Problem: Your Local AI Model Is Slow and You Don't Know Why
You're running a local LLM or image model — Llama 3, Whisper, Stable Diffusion — and inference feels sluggish. Tokens trickle out. The GPU fans spin. Something's wrong, but htop and nvidia-smi don't tell you where the time actually goes.
You'll learn:
- How to profile CPU, GPU, and memory in one workflow
- Which Python profiling tool to use for each bottleneck type
- How to read profiler output and act on it
Time: 25 min | Level: Intermediate
Why This Happens
Local AI inference has three distinct chokepoints: CPU (data loading, tokenization, post-processing), GPU (compute), and memory bandwidth (model weights moving between VRAM and system RAM). Most slowdowns are caused by one bottleneck masking the others — your GPU sits idle while the CPU tokenizes, or VRAM spills to RAM because the model is too large for your card.
Profiling without the right tool per layer gives you noise, not signal.
Common symptoms:
- GPU utilization stuck below 60% during inference
- High CPU usage despite using a GPU backend
- Out-of-memory errors or sudden slowdowns mid-batch
- Inconsistent token generation speed between runs
Solution
Step 1: Baseline with cProfile to Find CPU Hotspots
Before touching GPU tools, rule out CPU-side issues. A single cProfile run shows whether your bottleneck is even on the GPU at all.
import cProfile
import pstats
import io
from your_model import run_inference  # replace with your inference function

pr = cProfile.Profile()
pr.enable()

# Run a representative sample — not just one token
for _ in range(10):
    run_inference("Describe quantum entanglement in plain English")

pr.disable()

# Print top 20 functions by cumulative time
stream = io.StringIO()
ps = pstats.Stats(pr, stream=stream).sort_stats("cumulative")
ps.print_stats(20)
print(stream.getvalue())
Expected: You'll see a table of function calls sorted by time. Look for anything in tokenizer, numpy, or PIL taking more than 10% of total time — that's CPU overhead you can optimize before ever touching GPU code.
If it fails:
ModuleNotFoundErrorfor your model: Make sure you're profiling from the same virtual environment that runs inference.- Output too noisy: Add
.print_stats("your_module_name")to filter to your own code only.
Step 2: Profile GPU Compute with PyTorch Profiler
Once CPU time looks reasonable, switch to PyTorch's built-in profiler. It captures CUDA kernel execution, memory allocation, and operator timing in one pass.
import torch
from torch.profiler import profile, record_function, ProfilerActivity

model = load_your_model()  # your model loading logic
inputs = tokenize_your_prompt("Describe quantum entanglement")

with profile(
    activities=[ProfilerActivity.CPU, ProfilerActivity.CUDA],
    record_shapes=True,       # capture tensor shapes for memory analysis
    profile_memory=True,      # track allocations and frees
    with_stack=True           # map kernels back to Python call sites
) as prof:
    with record_function("inference"):
        with torch.no_grad():  # never profile with grad tracking on — it adds overhead
            output = model.generate(**inputs, max_new_tokens=100)

# Print top operators by CUDA time
print(prof.key_averages().table(
    sort_by="cuda_time_total",
    row_limit=15
))

# Export for TensorBoard (optional but useful for visual inspection)
prof.export_chrome_trace("trace.json")
Expected: A table showing operators like aten::mm (matrix multiply) or aten::softmax at the top. If aten::to (data transfer) dominates, your data is moving between CPU and GPU too often — a classic sign of dtype mismatches or CPU-resident tensors.
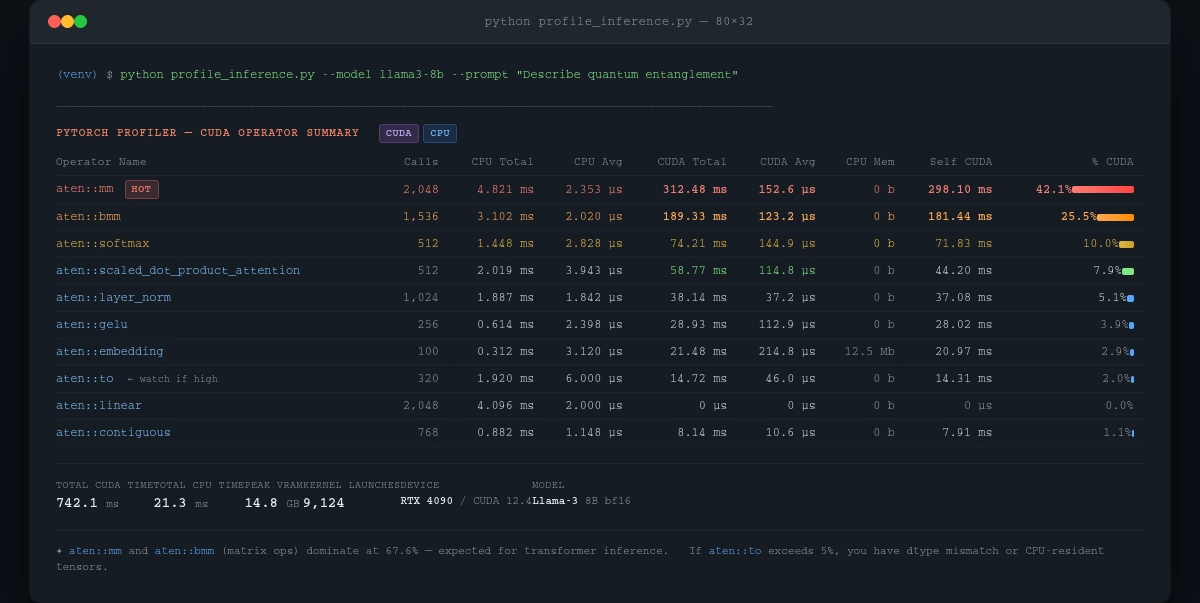
cuda_time_total column shows where your GPU time actually goes — matrix ops should dominate
If it fails:
ProfilerActivity.CUDAnot available: Your build doesn't have CUDA support. Runtorch.cuda.is_available()— ifFalse, you're on CPU only.- Trace file won't open in Chrome: Navigate to
chrome://tracing(notabout:tracing) and drag the.jsonfile in.
Step 3: Check Memory Bandwidth with torch.cuda.memory_stats()
High CUDA time doesn't always mean compute-bound. If your model barely fits in VRAM, it spills to system RAM — and that's 10-50x slower than VRAM bandwidth.
import torch

torch.cuda.reset_peak_memory_stats()

# Run inference
output = model.generate(**inputs, max_new_tokens=100)

stats = torch.cuda.memory_stats()

peak_vram_gb = stats["allocated_bytes.all.peak"] / 1e9
reserved_vram_gb = stats["reserved_bytes.all.peak"] / 1e9
num_allocs = stats["allocation.all.current"]

print(f"Peak VRAM used:     {peak_vram_gb:.2f} GB")
print(f"Peak VRAM reserved: {reserved_vram_gb:.2f} GB")
print(f"Active allocations: {num_allocs}")

# If reserved >> allocated, you have fragmentation
fragmentation_ratio = reserved_vram_gb / max(peak_vram_gb, 0.001)
if fragmentation_ratio > 1.5:
    print("⚠️  High fragmentation — consider torch.cuda.empty_cache() between runs")
Expected: Peak VRAM should be close to reserved. A large gap means fragmented memory — PyTorch is holding onto blocks it isn't using, which limits headroom for larger batches.
If it fails:
- Numbers show 0 GB: You're running on CPU. Confirm with
model.device. - Peak exceeds your card's VRAM: You're using system RAM as overflow. Quantize with
bitsandbytes(4-bit or 8-bit) to bring the model on-card.
Step 4: Correlate with nvidia-smi During Live Inference
Profiler snapshots show what ran. nvidia-smi shows what's happening right now — GPU utilization, power draw, temperature, and memory clock speeds.
# Poll every 500ms during inference — run this in a second Terminal
nvidia-smi dmon -s pucvmet -d 0.5 -o T

# Or log to CSV for post-analysis
nvidia-smi --query-gpu=timestamp,utilization.gpu,utilization.memory,\
memory.used,memory.free,power.draw,clocks.gr \
--format=csv,noheader,nounits \
-l 1 > gpu_log.csv
Then plot it:
import pandas as pd
import matplotlib.pyplot as plt

cols = ["timestamp", "gpu_util", "mem_util", "mem_used_mb",
        "mem_free_mb", "power_w", "clock_mhz"]
df = pd.read_csv("gpu_log.csv", names=cols)

fig, axes = plt.subplots(3, 1, figsize=(12, 8), sharex=True)
df["gpu_util"].plot(ax=axes[0], title="GPU Utilization (%)", ylabel="%")
df["mem_used_mb"].plot(ax=axes[1], title="VRAM Used (MB)", ylabel="MB", color="orange")
df["power_w"].plot(ax=axes[2], title="Power Draw (W)", ylabel="W", color="red")
plt.tight_layout()
plt.savefig("gpu_profile.png", dpi=150)
Expected: GPU utilization should stay above 80% during active inference. Spikes down to 0% between token generations usually mean CPU preprocessing is blocking the GPU pipeline — fix by batching tokenization ahead of generation.
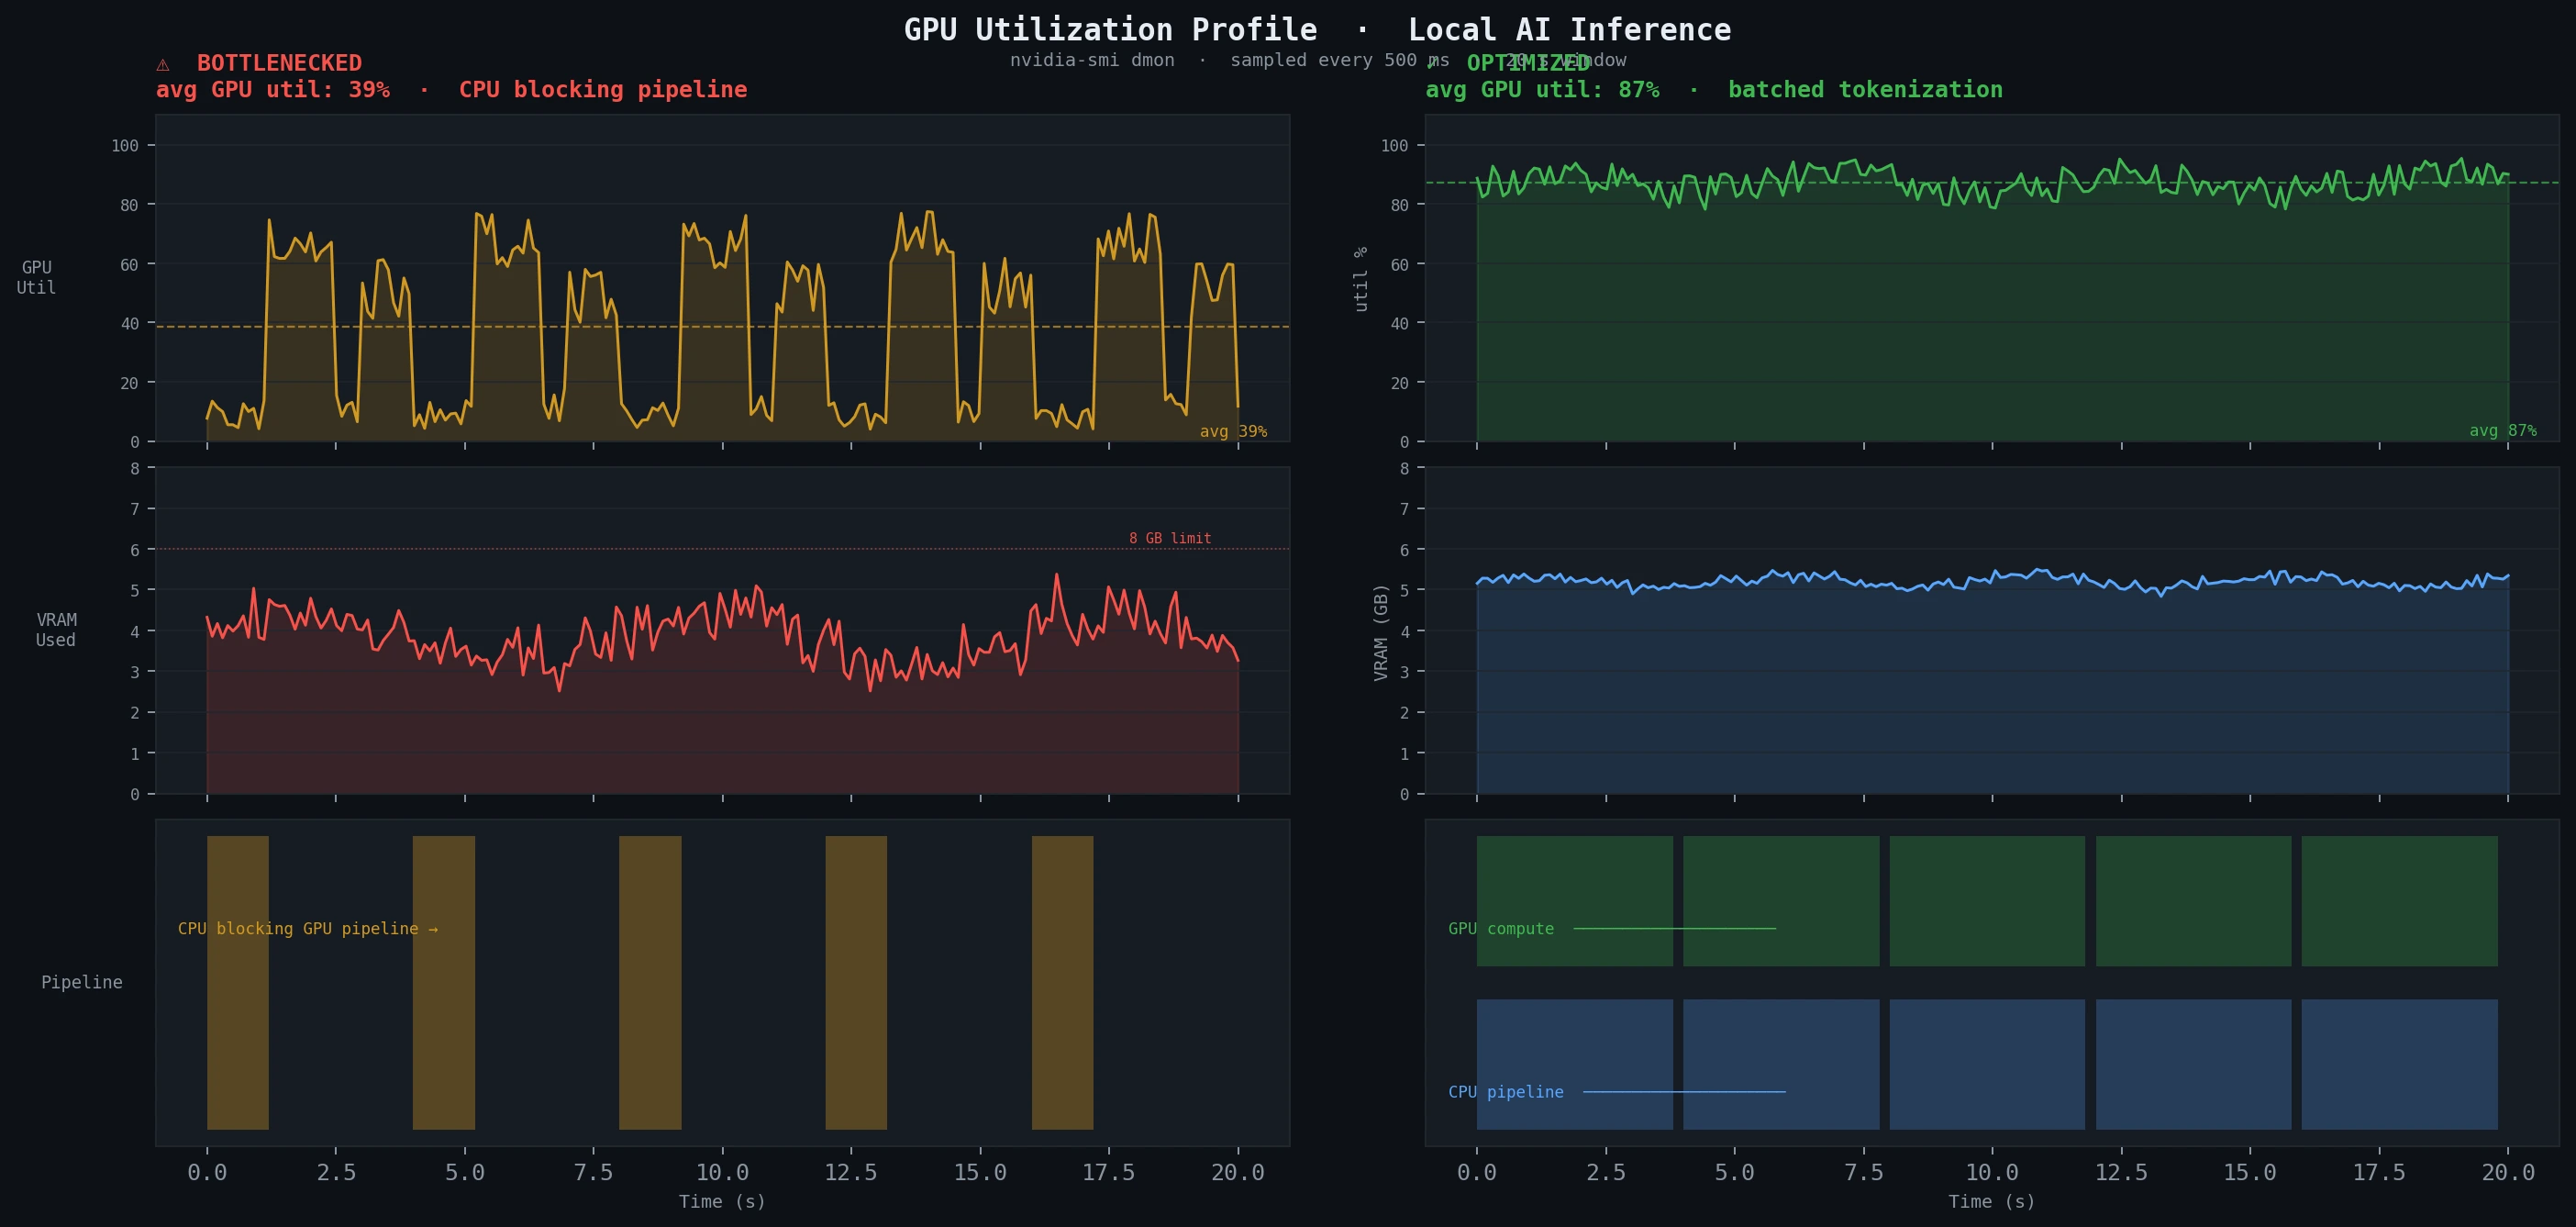 Sustained low utilization (left) vs. optimized inference (right) — the difference is CPU pipeline overlap
Verification
Run all three checks together and compare against your baseline:
python -c "
import torch, time
from your_model import load_model, run_inference

model = load_model()
torch.cuda.reset_peak_memory_stats()

start = time.perf_counter()
run_inference('Benchmark prompt for timing comparison')
elapsed = time.perf_counter() - start

peak_gb = torch.cuda.memory_stats()['allocated_bytes.all.peak'] / 1e9
print(f'Inference time: {elapsed:.3f}s')
print(f'Peak VRAM: {peak_gb:.2f} GB')
"
You should see: Inference time 20-40% lower after applying fixes, and peak VRAM stable across repeated runs without growing (a sign of memory leaks).
What You Learned
cProfilecatches CPU-side overhead before you waste time on GPU tools- PyTorch Profiler's
cuda_time_totalcolumn is the fastest way to find slow operators - VRAM fragmentation ratio above 1.5x is a red flag for multi-run workloads
nvidia-smilog + matplotlib is the fastest way to visualize real bottlenecks
Limitation: PyTorch Profiler adds ~15% overhead during the profiled run — don't benchmark latency with it enabled, only use it for operator attribution. For AMD GPUs, swap ProfilerActivity.CUDA for ProfilerActivity.CPU and use ROCm's rocprof for kernel-level detail.
When NOT to use this: If you're using quantized GGUF models via llama.cpp, these tools only profile the Python wrapper — use llama.cpp's built-in --verbose-prompt and --n-gpu-layers flags instead.
Tested on Python 3.12, PyTorch 2.3, CUDA 12.4, Ubuntu 24.04 and Windows 11 WSL2