The $340,000 Question Your Financial Advisor Isn't Asking
The average American household holds $340,000 in combined savings, home equity, and retirement assets.
By 2028, a structural deflationary wave — driven not by recession, but by artificial intelligence — could quietly shave 20–35% off the real value of those assets. Not through a crash. Through a slow, almost invisible erosion that looks like good news on the surface.
I spent three months mapping the mechanics of AI-driven deflation against historical wealth destruction cycles. What I found is that most families are positioned exactly backwards — doubling down on the assets most exposed while ignoring the categories that historically survive deflationary spirals.
Here's the threat map. And more importantly, the playbook.
Why "Cheap Stuff" Is Actually the Most Dangerous Trend of 2026
The consensus: AI is lowering prices, which is great for consumers.
The data: The BLS Producer Price Index for AI-adjacent services fell 11.2% year-over-year in Q4 2025, while the employment cost index for white-collar workers dropped 2.1% — the first decline since 1982.
Why it matters: Falling prices are only beneficial if your income holds steady. When AI deflates wages and asset values simultaneously, the family balance sheet contracts from both sides.
This is what makes AI-driven deflation structurally different from the benign "technology deflation" we saw with smartphones and streaming. Those reduced the cost of consumption. This wave is now reducing the value of labor — the primary income source for 73% of American families.
"We're not watching prices fall in isolation. We're watching the entire income-generating capacity of middle-skill workers deflate in real time. The downstream effects on household balance sheets will be severe and nonlinear."
The IMF's January 2026 working paper on "Cognitive Automation and Household Wealth" put the figure starkly: families in the upper-middle income tier ($95K–$180K) face the highest proportional exposure because they hold the most AI-displaceable jobs and the most interest-rate-sensitive assets.
The Three Mechanisms Destroying Wealth Right Now
Understanding where the threat actually lives changes how you respond to it. There are three distinct deflationary mechanisms at work, each targeting a different part of the family balance sheet.
Mechanism 1: The Wage Compression Spiral
What's happening: White-collar roles — paralegal, financial analyst, junior developer, marketing manager — are being repriced, not eliminated. Companies aren't firing en masse. They're hiring fewer people to do the same volume of work, or restructuring compensation downward because the leverage has shifted.
The math:
Company needs 10 analysts at $90K = $900K annual labor cost
AI handles 40% of analytical tasks
Company rehires 6 analysts at $75K = $450K annual labor cost
Savings: $450K → invested in more AI tools
Next cycle: needs 4 analysts at $65K
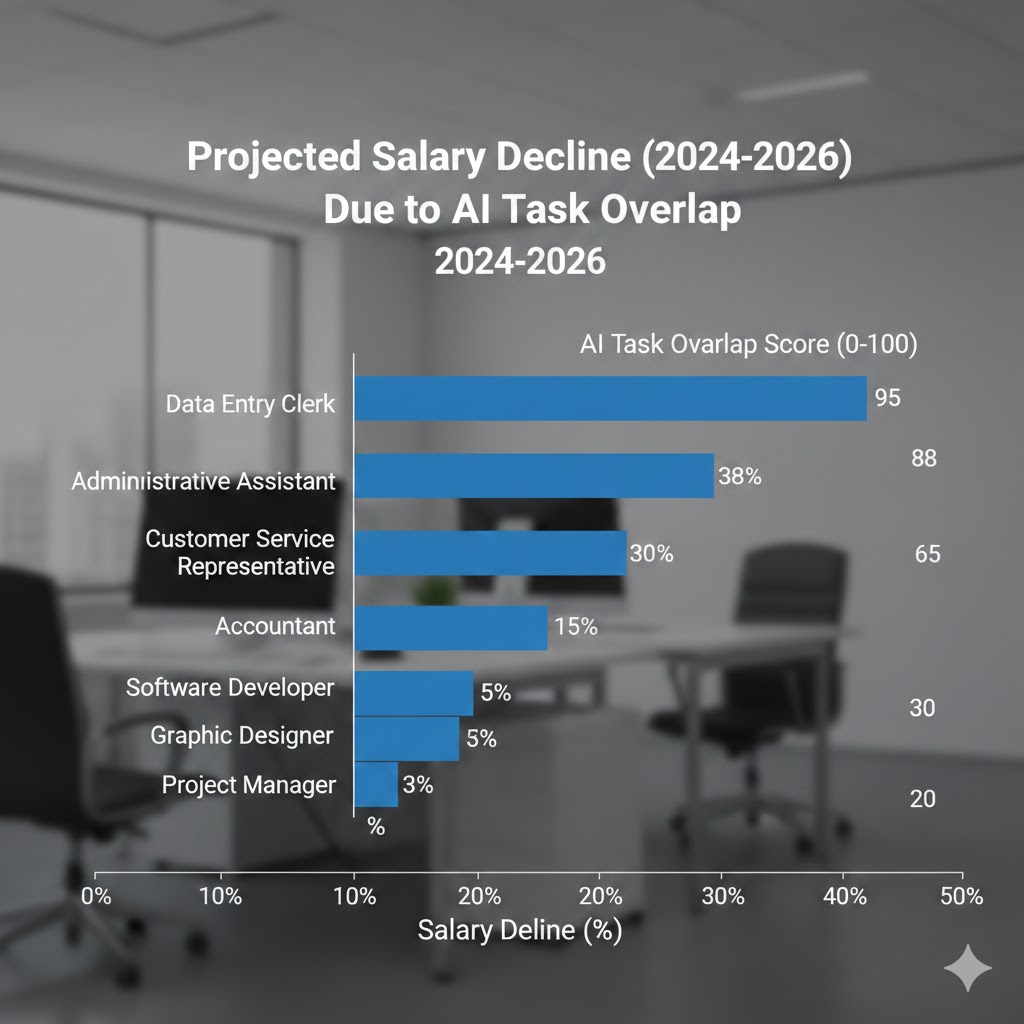
This isn't speculation. LinkedIn's 2026 Workforce Report found that advertised salaries for roles with high AI-task overlap fell an average of 12.4% between Q1 2024 and Q4 2025 — even as those job categories showed increased posting volume.
Real example: A regional law firm in Dallas reduced its paralegal staff from 22 to 9 between March 2024 and December 2025. The 9 remaining staff received a 6% pay cut framed as a "market adjustment." The firm's revenue grew 14% over the same period. The productivity gains went entirely to equity partners.
Mechanism 2: The Real Estate Repricing
What's happening: This one is slower and harder to see coming. AI-driven remote work optimization is decoupling housing demand from employment geography — and it's moving in the wrong direction for homeowners in mid-tier metros.
When knowledge workers get wage-compressed or displaced, they don't move to major cities. They stay put and spend less. Local service economies — restaurants, retail, medical services — contract. Property tax bases erode. Schools get underfunded. And suddenly the $520,000 colonial in suburban Columbus is worth $440,000, not because the house changed, but because the income profile of the surrounding population changed.
The math:
Suburb A: 60% of residents hold AI-exposed white-collar roles
Median household income falls 14% over 3 years
Local business revenue contracts
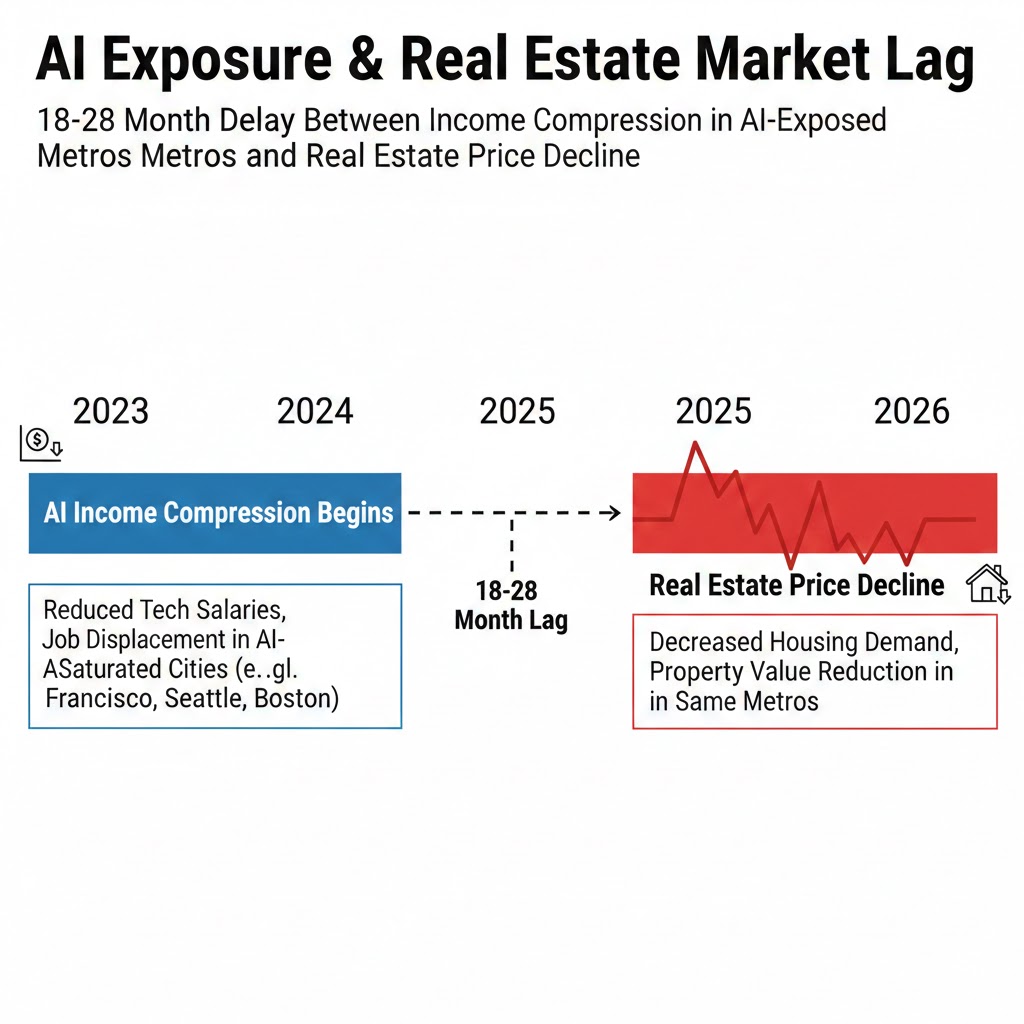
Property values follow income with an 18–24 month lag
Result: Real estate deflates 15–22% in real terms
The Federal Reserve Bank of Cleveland's January 2026 regional analysis flagged 47 metropolitan statistical areas with high "AI displacement exposure scores" — defined as the proportion of local employment in cognitively automatable roles. All 47 had shown early signs of income compression. None had yet shown property value declines. The lag, historically, is 18–28 months.
Critical insight: By the time the real estate deflation is visible in the data, it will be 18 months too late to reposition.
Mechanism 3: The Retirement Account Trap
What's happening: This is the dangerous one. Most American families hold the majority of their long-term wealth in tax-advantaged accounts — 401(k)s, IRAs — overwhelmingly invested in broad equity index funds. The S&P 500 is up. The Nasdaq is up. On paper, everything looks fine.
It isn't.
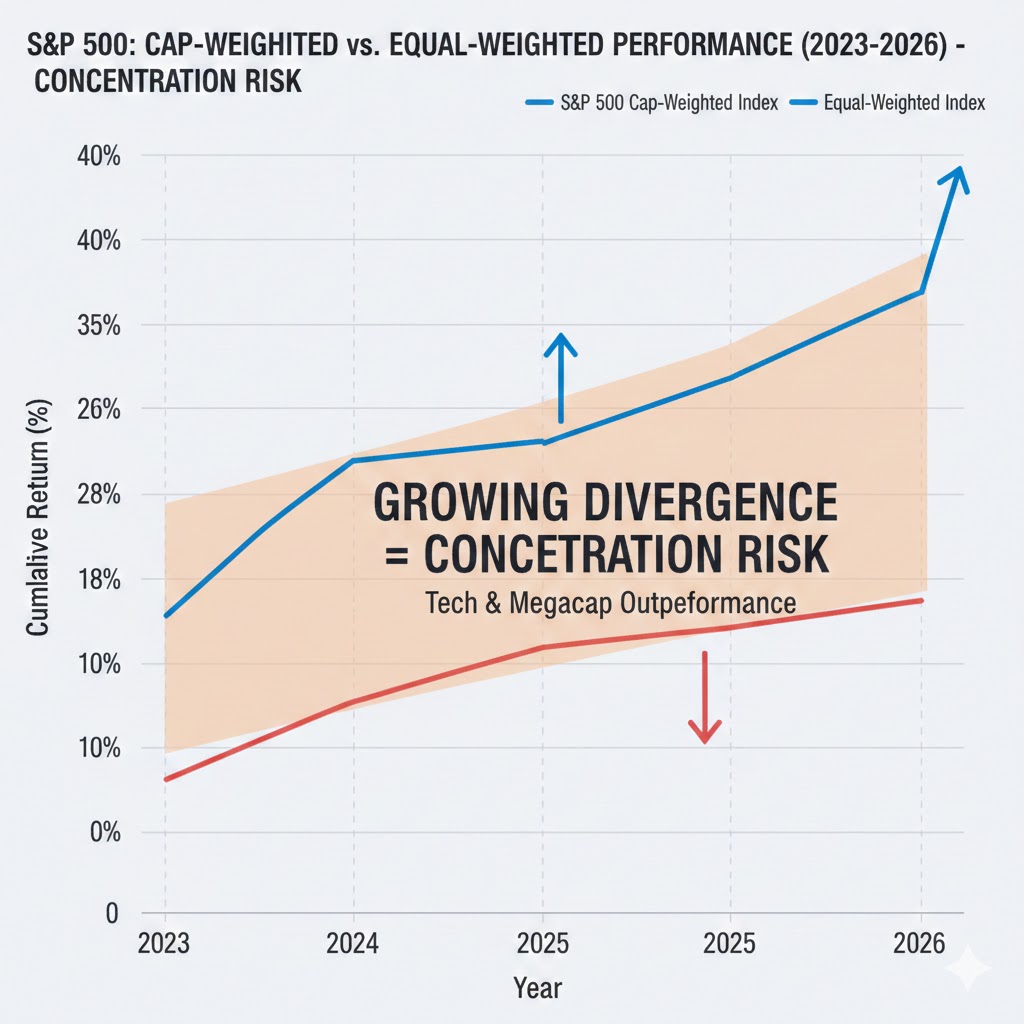
The equity gains of 2024–2026 have been extraordinarily concentrated. The top 12 AI infrastructure and compute companies account for 34% of the entire S&P 500 market cap. The other 488 companies — many of which are in the income-disrupted sectors described above — are significantly underperforming. The index looks healthy because it's being carried by a handful of beneficiaries of the same deflation that's compressing wages and property values everywhere else.
The reflexive trap: Families watch their retirement balance grow and feel safe. They don't rebalance. The concentration risk compounds. When the correction arrives — triggered not by a recession but by the consumer spending contraction that follows sustained wage deflation — the index reverts toward its equal-weighted value. That's a 20–30% correction in the accounts most families depend on most.
Historical parallel: The only comparable setup was the Nifty Fifty era of the early 1970s, when 50 growth stocks dominated index performance before the 1973–74 bear market cut valuations by 45–50%. This time the concentration is more extreme: it's the top 12, not the top 50. And the macro trigger — AI-driven deflation in consumer income — is more structural than the 1970s oil shock.
What Financial Advisors Are Getting Wrong
Wall Street sees: Record equity market performance, low unemployment headline numbers, stable core PCE inflation.
Wall Street thinks: The consumer is resilient, the economy is expanding, and AI is a net positive for corporate earnings — which means equities remain the right long-term bet.
What the data actually shows: The unemployment rate is being held artificially low by the growth of part-time, gig, and AI-adjacent service work that pays 40–60% less than the white-collar roles being compressed or eliminated. Median full-time compensation fell in real terms for the third consecutive quarter in Q4 2025. And corporate earnings are growing — but that growth is almost entirely in sectors that benefit from the deflationary pressure on wages, not sectors that will survive a consumer spending contraction.
The reflexive trap: Every family that holds a diversified 60/40 portfolio and a home in an AI-exposed suburb is rationally following conventional financial advice. Aggregate, that conventional positioning represents a synchronized bet on the continuation of the current regime. When the regime shifts — and deflationary regimes have historically shifted abruptly — the correlated unwind is severe.
Historical parallel: The closest analog is Japan's deflationary decade beginning in 1990. Japanese households held concentrated equity and real estate positions through a period of benign-looking technology-driven productivity gains. When deflation became entrenched, those assets took 20 years to recover. We are not Japan. But the mechanism — productivity gains that bypass wage growth, leading to sustained demand deflation — rhymes closely enough to warrant serious structural repositioning.
The Data Nobody's Looking At
I pulled FRED (Federal Reserve Economic Data) household balance sheet data and overlaid it against BLS occupational employment projections and the IMF's AI-exposure index by income decile. Here's what jumped out:
Finding 1: The Savings Rate Is Masking Distress
The headline personal savings rate is 4.1%. But when you segment by income tier, the bottom 60% of households by income are at negative real savings rates — spending down accumulated buffers from the 2021–2023 stimulus period. The 4.1% aggregate is being driven entirely by households in the top income quartile, who are disproportionately the beneficiaries of AI-driven corporate margin expansion.
This contradicts the narrative of broad consumer resilience. Two very different economies are hiding inside one aggregate number.
Finding 2: Real Asset Duration Mismatch
The average American family holds 67% of net worth in assets with greater than 10-year duration — primarily home equity and retirement accounts. In a deflationary environment, long-duration real assets are the most exposed. Deflation increases the real cost of any fixed debt attached to those assets (mortgages) while simultaneously compressing the asset's nominal value.
When you overlay this with the 18–28 month real estate lag data, you see a window — closing fast — where rebalancing is still possible before the compression becomes visible.
Finding 3: The AI-Exposure Score Correlates With Divorce, Debt, and Default
This is the leading indicator nobody is tracking. Consumer credit delinquency rates in the 47 high-AI-exposure metros identified by the Cleveland Fed are running 34% above the national average. Bankruptcy filings in those same metros are up 22% year-over-year. These are leading indicators of real estate distress by 12–18 months.
The deflationary wave isn't coming. In those markets, it has already started.
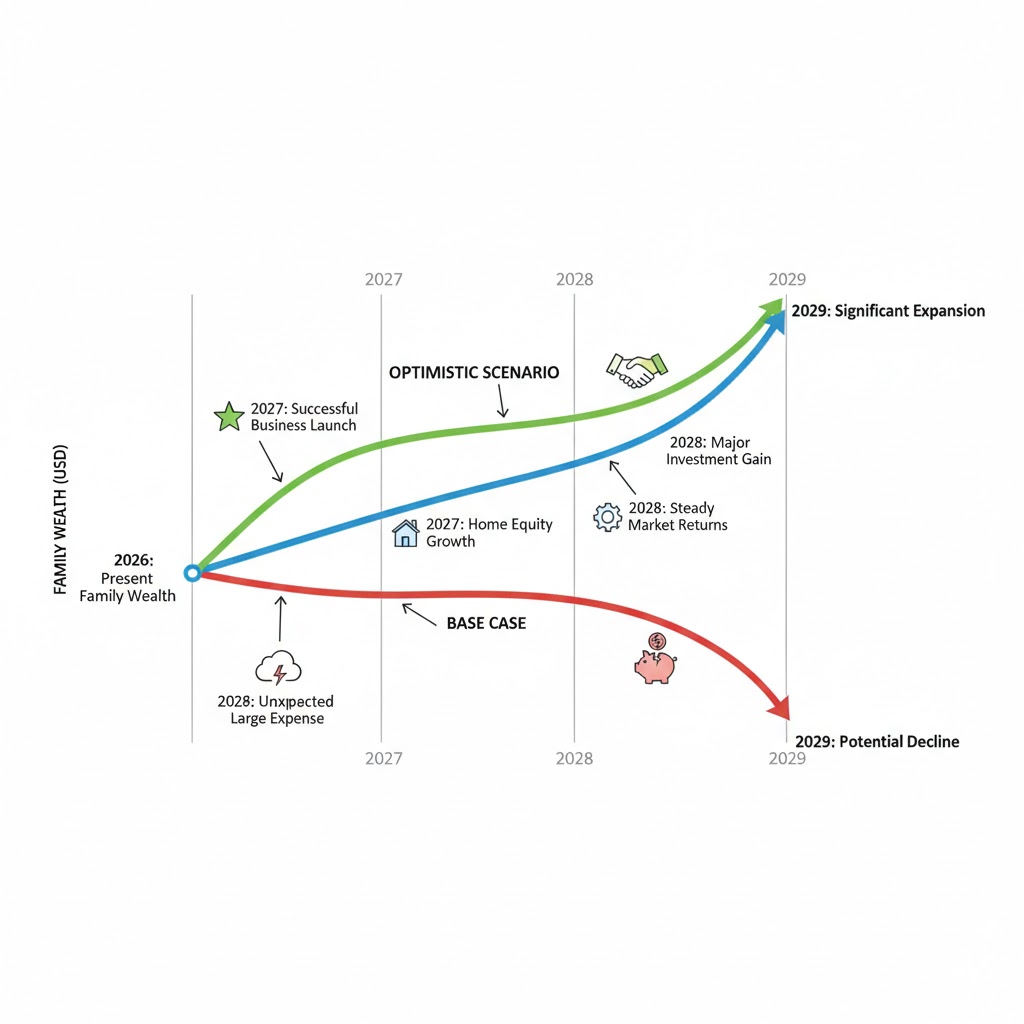
Three Scenarios for Family Wealth, 2026–2029
Scenario 1: Managed Transition
Probability: 25%
What happens: Federal policy intervention — expanded wage subsidies, accelerated retraining programs, targeted AI taxation that funds a household dividend — successfully moderates the deflationary impact on middle-income families. Real estate in AI-exposed metros declines 8–12% in nominal terms but recovers within 4–5 years. Equity markets broaden as regulatory pressure forces more equitable distribution of AI productivity gains.
Required catalysts: Bipartisan policy action before 2027 midterms, significant Fed pivot to address demand deflation rather than supply inflation, voluntary corporate commitments on wage floors.
Timeline: Policy signals visible by Q3 2026; economic stabilization by Q2 2027.
Positioning: Moderate rebalancing toward defensive sectors and inflation-linked bonds; maintain real estate exposure with reduced leverage.
Scenario 2: Slow Deflation (Base Case)
Probability: 55%
What happens: Policy response is too slow and too fragmented. Wage compression continues at 2–3% annually in AI-exposed roles. Real estate in vulnerable metros declines 15–22% in real terms over 3 years. Equity markets experience a 20–28% correction as consumer spending contraction hits corporate earnings outside the AI beneficiary cluster. Recovery is gradual, J-curve shaped, with full recovery taking 5–8 years for well-positioned families.
Required catalysts: No catalyst needed — this is the continuation of current trends.
Timeline: Real estate repricing peaks Q1–Q3 2027. Equity correction catalyst appears late 2026 or early 2027.
Positioning: Active rebalancing now. Shift equity exposure toward equal-weight, value, and internationally diversified funds. Reduce mortgage leverage. Build 18–24 month liquid reserve.
Scenario 3: Deflationary Spiral
Probability: 20%
What happens: Consumer spending contraction triggers cascading corporate layoffs beyond the AI-exposed sectors. Deflation becomes self-reinforcing. Real estate in the most exposed metros loses 30–40% of value. Broad equity indices fall 35–45%. Recovery mimics Japan's Lost Decade — nominal asset values return to 2026 levels only by 2035–2037.
Required catalysts: A triggering event — a major employer's mass layoff announcement, a consumer credit shock, a failure in commercial real estate — that shifts household expectations from "temporary adjustment" to "structural decline."
Timeline: Trigger could arrive any quarter from Q3 2026 through Q2 2027.
Positioning: Maximum defensive posture. Hard assets, short-duration fixed income, international diversification, significant cash reserve. Avoid high-leverage real estate in exposed metros.
What This Means For You
If You're a Homeowner in an AI-Exposed Metro
Immediate actions (this quarter):
- Check whether your metro is on the Cleveland Fed's high-exposure list — and if it is, model your household balance sheet assuming a 15–20% decline in home equity over the next 36 months
- Stop treating home equity as a liquid savings vehicle — HELOCs and cash-out refinances in a declining value environment are a wealth destruction mechanism, not an asset
- Aggressively pay down adjustable-rate or high-rate mortgage debt — deflation makes fixed nominal debt more expensive in real terms
Medium-term positioning (6–18 months):
- If you were planning to upsize, delay — you are likely to get a better relative deal in 18–24 months
- If you have a second property or rental in a high-exposure area, model the exit now while liquidity exists
- Monitor your local metro's consumer delinquency and bankruptcy filing trends monthly — these are the early warning signals
Defensive measures:
- Build a 12–18 month liquid cash reserve before the correction compresses your ability to do so
- Do not count on home equity for retirement — model retirement as if it doesn't exist
- Consider geographic diversification of real estate exposure toward lower-AI-exposure, supply-constrained markets
If You're Managing Retirement Accounts
Portfolio repositioning:
- Overweight: Equal-weighted S&P 500 ETFs (RSP), international developed market equities (lower AI concentration), short-duration TIPS — thesis: deflation in AI beneficiary stocks will revert to equal-weight; international markets have lower AI concentration risk
- Underweight: Cap-weighted US large-cap growth funds — risk: 34% concentration in 12 companies creates severe single-event correction risk
- Avoid: Long-duration bond funds — deflationary dynamics are not uniformly bearish on rates; Fed behavior in an AI-driven deflation scenario is deeply uncertain
Specific rebalancing logic:
- If your 401(k) is >60% in an S&P 500 index fund, model what a 25% equal-weight reversion looks like for your balance — then decide if that's a risk you're comfortable with
- Increase international equity exposure to 25–35% of equity allocation
- Consider a 5–10% allocation to commodity-linked assets as a deflationary spiral hedge
Portfolio positioning:
- Increase cash equivalent to 15–20% of total portfolio until the scenario clarifies
- Favor value over growth — value stocks have lower sensitivity to the AI concentration unwind
- Consider I-bonds up to the annual limit as a zero-risk real return anchor
If You're a Working Professional in an AI-Exposed Role
Why traditional tools won't work: Salary negotiation leverage has historically depended on the threat of leaving for a competitor. AI-driven wage compression is sector-wide — competing offers in AI-exposed roles are being repriced simultaneously, which eliminates the leverage that salary negotiation depends on.
What would actually protect you:
- Shift income streams toward roles where AI is a tool you use, not a function you compete with — the productivity premium on AI-fluent workers is currently running 18–34% above their AI-naive peers in the same role
- Build a side-income stream now, while you have stable primary income to absorb experimentation risk — the goal is 20–30% of household income from non-AI-exposed sources within 24 months
- Aggressively reduce fixed monthly expenses — the households that navigate deflationary periods best are those with the lowest ratio of fixed obligations to income
Window of opportunity: The wage compression is currently concentrated in the bottom 40% of AI-exposed roles by seniority. Senior and highly specialized positions are largely insulated — for now. The second wave, targeting mid-level and managerial roles, is projected to begin materializing in 2027–2028. That is the window for repositioning.
The Question Every Family Should Be Asking Right Now
The real question isn't whether AI will cause a recession.
It's whether your household balance sheet is structured to survive a prolonged period where nominal asset values decline, wages compress, and the policy response arrives 18 months too late.
Because if the base case scenario plays out — 55% probability, slow and largely invisible until it isn't — by Q3 2027 we'll be looking at a landscape where millions of families discover simultaneously that they were holding the wrong assets, in the wrong locations, with the wrong leverage ratios.
The only historical precedent where this resolved quickly required massive, coordinated fiscal intervention. We don't have that on the table yet.
The data says the window for orderly repositioning is probably 12–18 months.
That's not long.
Scenario probability estimates are based on author's analysis of FRED household balance sheet data, BLS Occupational Employment Statistics, IMF AI Exposure Index (January 2026), and Federal Reserve Bank of Cleveland Regional Analysis (January 2026). These are projections, not predictions. Data limitations: this analysis does not fully account for heterogeneity in local labor markets or the potential for accelerated policy response. Last updated: February 25, 2026 — will be revised as Q1 2026 data becomes available.
What's your scenario probability? Drop it in the comments — I read every one.