Problem: Your AI Agents Don't Scale
You've got AI agents working in development. Now you need a hundred of them. Then a thousand. Running agent workloads at scale isn't just "more pods" — agents have unique scheduling needs, long-running tasks, unpredictable memory spikes, and stateful execution that breaks standard Kubernetes patterns.
You'll learn:
- How to model agent workloads as Kubernetes Jobs and Deployments correctly
- Autoscaling strategies tuned for LLM inference latency and queue depth
- Fault tolerance patterns that prevent cascading failures across agent fleets
Time: 30 min | Level: Advanced
Why This Happens
Standard Kubernetes is built around stateless, short-lived, CPU-predictable workloads. AI agents are the opposite — they hold context, make long outbound calls, consume memory unpredictably, and fail in ways that aren't HTTP 500s.
Common symptoms:
- Agents OOMKilled mid-task with no retry
- Autoscaler provisions pods faster than GPU/LLM capacity can serve them
- One bad agent floods the entire cluster with retries
- Jobs complete but results are lost because the pod was evicted
The fix requires rethinking resource models, queue integration, and pod lifecycle management from the ground up.
 Three-layer architecture: queue → dispatcher → agent worker pool
Solution
Step 1: Model Agent Tasks as Jobs, Not Deployments
Agents do discrete work. Use Job resources with completionMode: Indexed so each agent has a unique identity and Kubernetes tracks completion properly.
# agent-job.yaml
apiVersion: batch/v1
kind: Job
metadata:
  name: agent-batch-run
  labels:
    app: ai-agent
    team: platform
spec:
  completions: 100          # Total agents to run
  parallelism: 20           # Run 20 at a time
  completionMode: Indexed   # Each pod gets a unique index via JOB_COMPLETION_INDEX
  backoffLimit: 3           # Retry failed pods up to 3x before marking job failed
  ttlSecondsAfterFinished: 3600  # Clean up 1 hour after completion
  template:
    spec:
      restartPolicy: OnFailure
      containers:
        - name: agent
          image: your-registry/ai-agent:1.4.2
          resources:
            requests:
              memory: "2Gi"
              cpu: "500m"
            limits:
              memory: "4Gi"   # Allow burst for large context windows
              cpu: "2000m"
          env:
            - name: AGENT_INDEX
              valueFrom:
                fieldRef:
                  fieldPath: metadata.annotations['batch.kubernetes.io/job-completion-index']
            - name: TASK_QUEUE_URL
              valueFrom:
                secretKeyRef:
                  name: agent-secrets
                  key: queue-url
Expected: Kubernetes creates 20 pods, tracks completions, retries failures, and cleans itself up.
If it fails:
- OOMKilled: Increase
limits.memory— 4Gi is a starting point, profile your agent's peak usage - Pods stuck Pending: Check node capacity with
kubectl describe nodes | grep Allocatable
Step 2: Set Up Queue-Based Autoscaling with KEDA
Don't scale on CPU. Agents sit idle waiting on LLM responses — CPU stays low while work piles up. Scale on queue depth instead using KEDA.
# Install KEDA
helm repo add kedacore https://kedacore.github.io/charts
helm install keda kedacore/keda --namespace keda --create-namespace
# agent-scaledjob.yaml
apiVersion: keda.sh/v1alpha1
kind: ScaledJob
metadata:
  name: agent-scaledjob
  namespace: agents
spec:
  jobTargetRef:
    template:
      spec:
        containers:
          - name: agent
            image: your-registry/ai-agent:1.4.2
            resources:
              requests:
                memory: "2Gi"
                cpu: "500m"
              limits:
                memory: "4Gi"
                cpu: "2000m"
        restartPolicy: OnFailure

  pollingInterval: 15       # Check queue every 15 seconds
  maxReplicaCount: 500      # Hard ceiling — protect downstream LLM APIs
  successfulJobsHistoryLimit: 5
  failedJobsHistoryLimit: 10

  triggers:
    - type: rabbitmq        # Or sqs, redis, kafka — KEDA supports 60+ sources
      metadata:
        protocol: amqp
        queueName: agent-tasks
        mode: QueueLength
        value: "5"          # 1 agent pod per 5 queued messages
      authenticationRef:
        name: rabbitmq-auth
# rabbitmq-auth.yaml — store credentials safely
apiVersion: keda.sh/v1alpha1
kind: TriggerAuthentication
metadata:
  name: rabbitmq-auth
  namespace: agents
spec:
  secretTargetRef:
    - parameter: host
      name: agent-secrets
      key: rabbitmq-host
Expected: Queue depth of 50 messages → KEDA provisions 10 agent pods within ~30 seconds.
If it fails:
- ScaledJob not triggering: Run
kubectl describe scaledjob agent-scaledjob— check theConditionssection for authentication errors - Over-provisioning: Lower
maxReplicaCountor increase thevalueratio
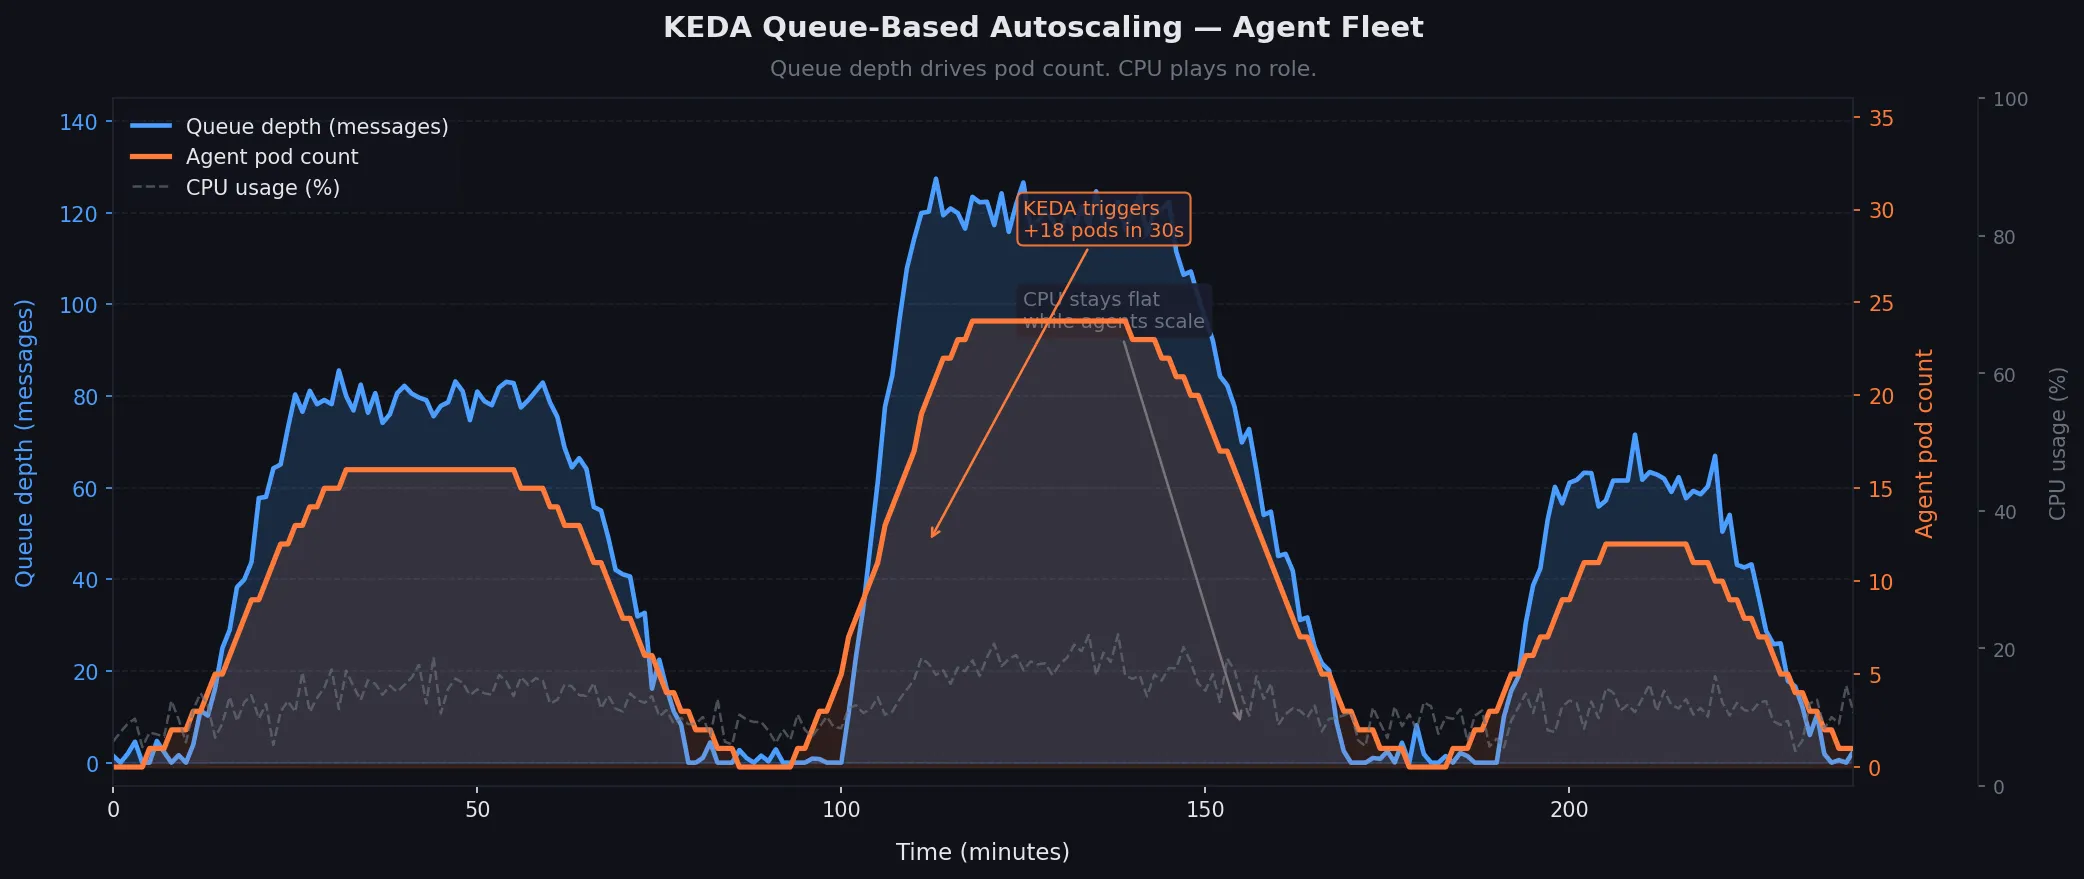 Queue depth (blue) drives pod count (orange) — CPU plays no role
Step 3: Prevent Cascading Failures with PodDisruptionBudgets and Circuit Breakers
One bad model endpoint can cause every agent to retry simultaneously, DDoSing your infrastructure. You need two things: protect running agents from eviction, and rate-limit retries at the cluster level.
# agent-pdb.yaml — never evict more than 10% of running agents at once
apiVersion: policy/v1
kind: PodDisruptionBudget
metadata:
  name: agent-pdb
  namespace: agents
spec:
  maxUnavailable: "10%"
  selector:
    matchLabels:
      app: ai-agent
For retry storms, add exponential backoff directly into your agent container and enforce it via a LimitRange that caps pod restarts:
# namespace-limits.yaml
apiVersion: v1
kind: LimitRange
metadata:
  name: agent-limits
  namespace: agents
spec:
  limits:
    - type: Container
      default:
        memory: "2Gi"
        cpu: "1000m"
      defaultRequest:
        memory: "1Gi"
        cpu: "250m"
      max:
        memory: "8Gi"      # Hard ceiling — prevents runaway context accumulation
        cpu: "4000m"
Add a NetworkPolicy to isolate agent pods so a compromised agent can't reach internal services:
# agent-netpol.yaml
apiVersion: networking.k8s.io/v1
kind: NetworkPolicy
metadata:
  name: agent-isolation
  namespace: agents
spec:
  podSelector:
    matchLabels:
      app: ai-agent
  policyTypes:
    - Ingress
    - Egress
  egress:
    - to:                    # Agents can only reach: the LLM gateway and task queue
      - namespaceSelector:
          matchLabels:
            name: llm-gateway
      - namespaceSelector:
          matchLabels:
            name: message-queue
    - ports:
      - port: 53             # Allow DNS
        protocol: UDP
Expected: Evictions are throttled, runaway pods are memory-capped, and blast radius is contained to the agents namespace.
Step 4: Persist Agent State Before Pod Death
Agents die mid-task. Kubernetes will evict your pod with 30 seconds warning via SIGTERM. Use that window to checkpoint state.
# agent/main.py
import signal
import sys
import json
import os

class Agent:
    def __init__(self):
        self.checkpoint_path = f"/checkpoints/agent-{os.environ['AGENT_INDEX']}.json"
        signal.signal(signal.SIGTERM, self.handle_sigterm)
        self.state = self.load_checkpoint()

    def handle_sigterm(self, signum, frame):
        # Kubernetes sends SIGTERM 30s before SIGKILL — use every second
        print("SIGTERM received — checkpointing state")
        self.save_checkpoint()
        sys.exit(0)

    def save_checkpoint(self):
        with open(self.checkpoint_path, 'w') as f:
            json.dump(self.state, f)

    def load_checkpoint(self):
        if os.path.exists(self.checkpoint_path):
            with open(self.checkpoint_path) as f:
                return json.load(f)  # Resume from where we left off
        return {"step": 0, "results": []}
Mount a PersistentVolumeClaim so checkpoints survive pod death:
# In your Job spec
volumes:
  - name: checkpoints
    persistentVolumeClaim:
      claimName: agent-checkpoints
containers:
  - name: agent
    volumeMounts:
      - name: checkpoints
        mountPath: /checkpoints
# agent-pvc.yaml
apiVersion: v1
kind: PersistentVolumeClaim
metadata:
  name: agent-checkpoints
  namespace: agents
spec:
  accessModes:
    - ReadWriteMany      # Multiple pods can write simultaneously
  resources:
    requests:
      storage: 10Gi
  storageClassName: efs  # AWS EFS or equivalent shared storage
Expected: Pod evicted → new pod starts → reads checkpoint → continues from step N instead of step 0.
Step 5: Observe Everything with Structured Logging and Metrics
At a thousand agents, kubectl logs doesn't scale. Ship structured logs and expose Prometheus metrics from day one.
# agent/logging.py
import structlog
import prometheus_client as prom

# Prometheus metrics — scraped by your cluster's Prometheus operator
tasks_completed = prom.Counter('agent_tasks_completed_total', 'Tasks finished', ['status'])
task_duration = prom.Histogram('agent_task_duration_seconds', 'Time per task')
llm_tokens_used = prom.Counter('agent_llm_tokens_total', 'LLM tokens consumed', ['model'])

log = structlog.get_logger()

def run_task(task):
    log.info("task_started", task_id=task.id, agent_index=os.environ['AGENT_INDEX'])

    with task_duration.time():
        result = execute(task)

    tasks_completed.labels(status="success").inc()
    llm_tokens_used.labels(model="claude-sonnet-4").inc(result.tokens)
    log.info("task_completed", task_id=task.id, tokens=result.tokens)
Expose metrics so Prometheus can scrape them:
# Add to your container spec
ports:
  - name: metrics
    containerPort: 8080

# Add annotation so Prometheus discovers the pod automatically
metadata:
  annotations:
    prometheus.io/scrape: "true"
    prometheus.io/port: "8080"
    prometheus.io/path: "/metrics"
Expected: Grafana shows per-agent task rates, token consumption, and duration percentiles across your entire fleet.
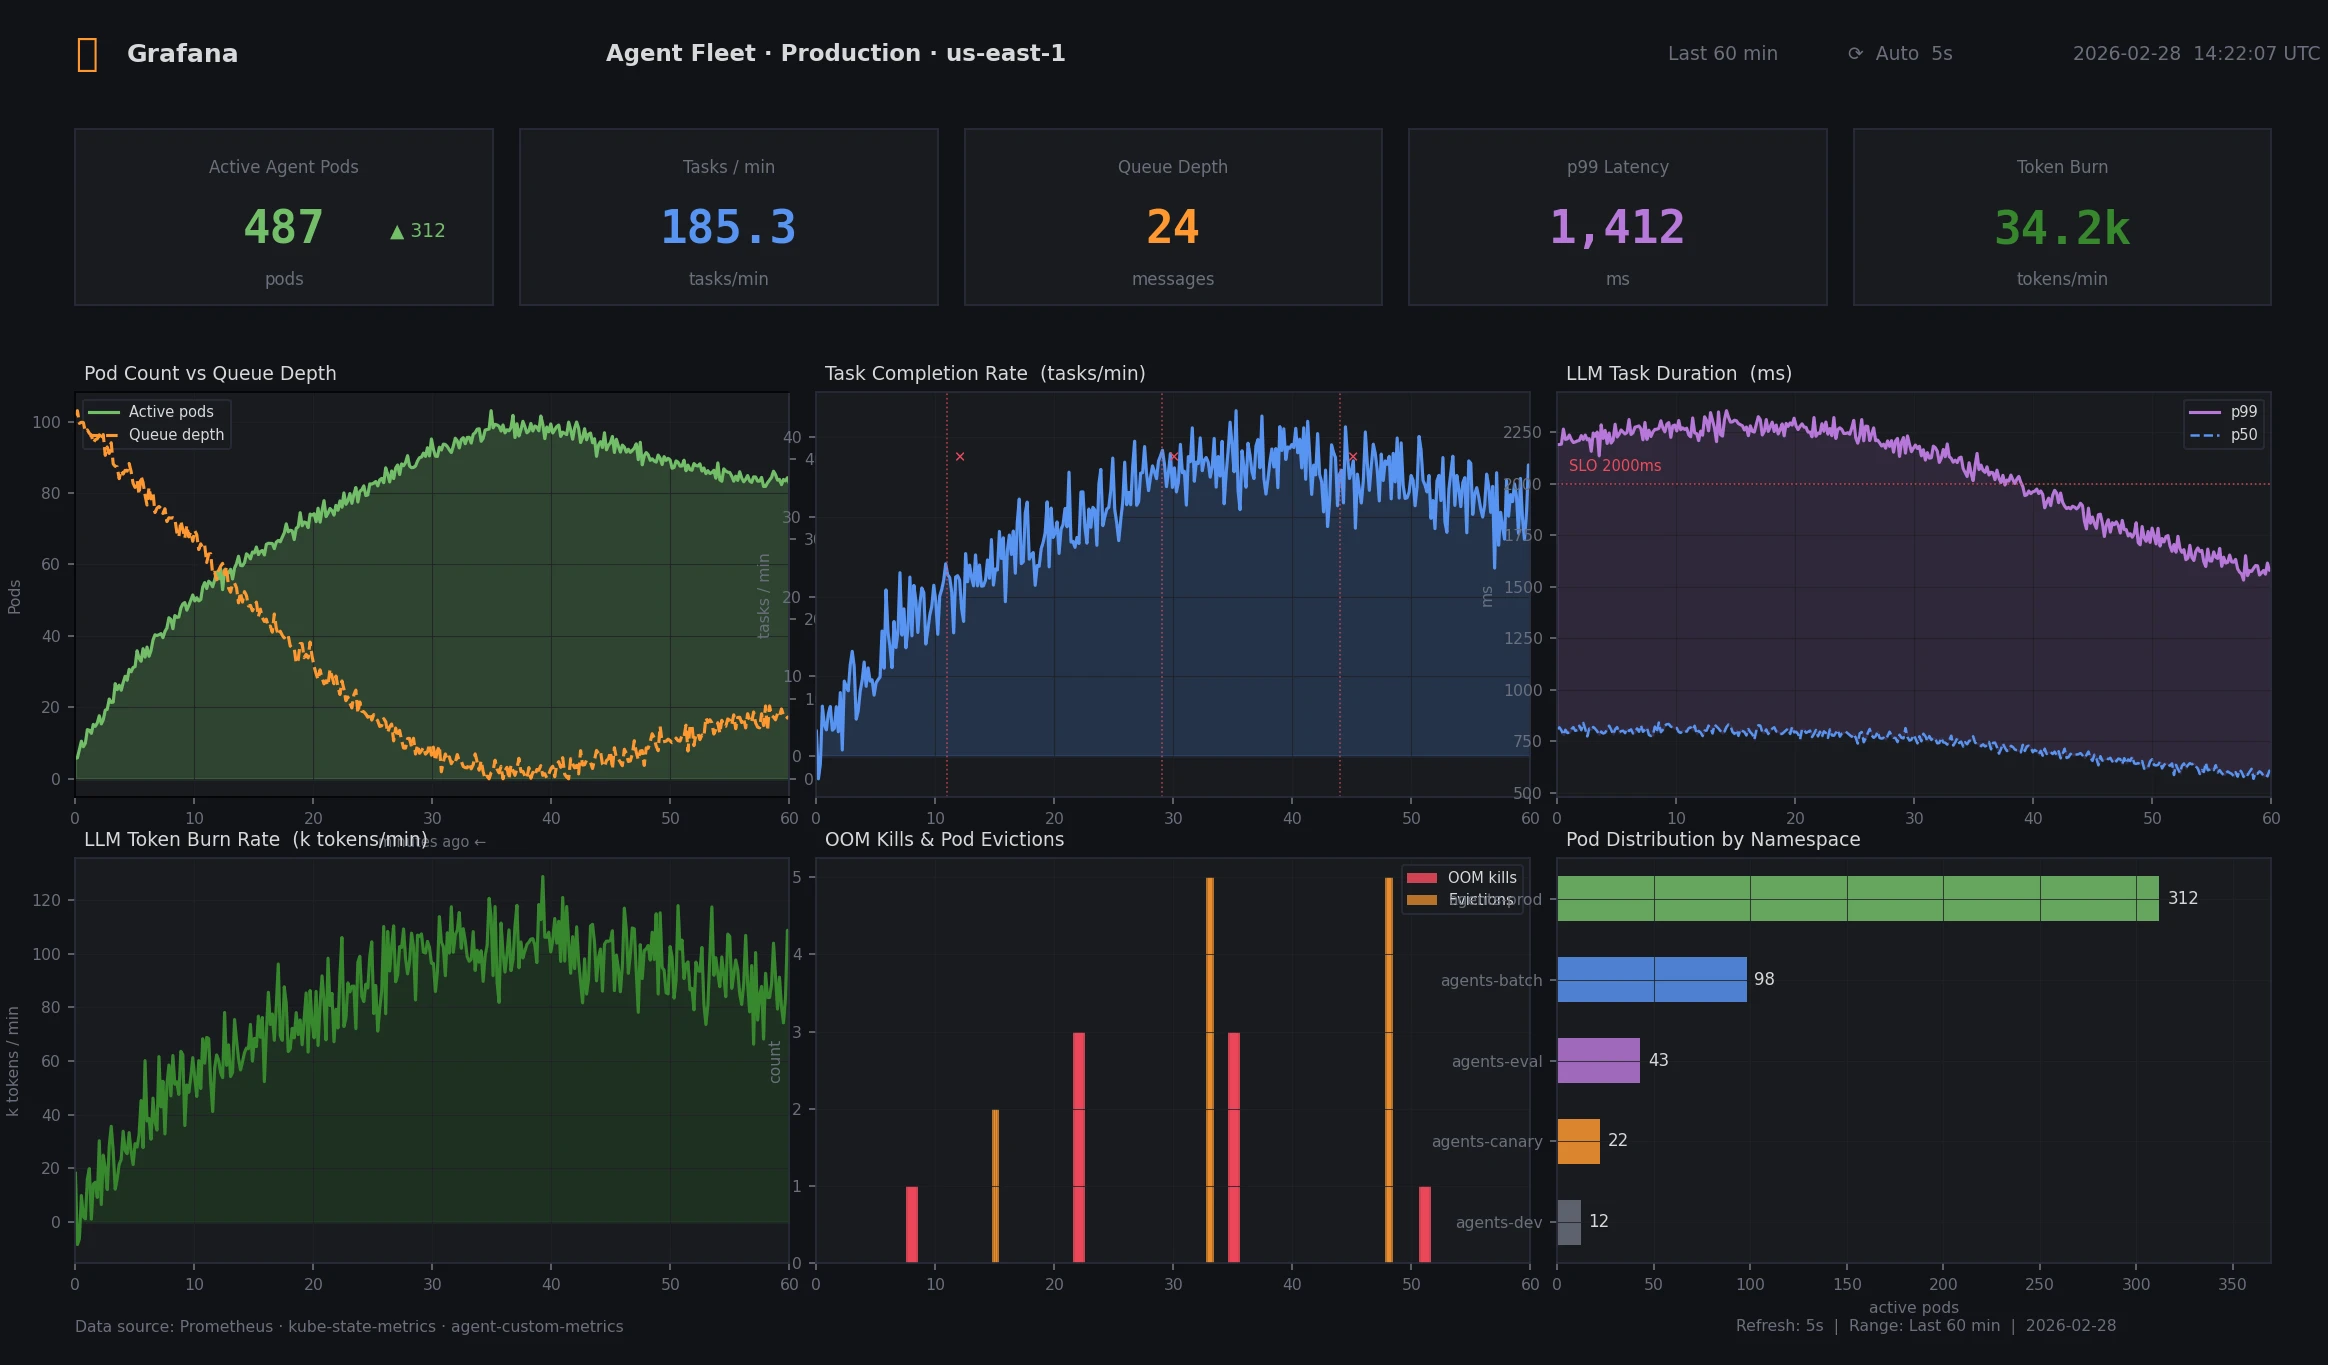 p99 task duration and token burn rate across 500 agent pods
Verification
Deploy the full stack and run a smoke test with 10 agents before scaling:
# Apply all manifests
kubectl apply -f agent-secrets.yaml
kubectl apply -f namespace-limits.yaml
kubectl apply -f agent-pvc.yaml
kubectl apply -f agent-pdb.yaml
kubectl apply -f agent-netpol.yaml
kubectl apply -f rabbitmq-auth.yaml
kubectl apply -f agent-scaledjob.yaml

# Push 10 test messages to the queue
python scripts/seed_queue.py --count 10 --queue agent-tasks

# Watch pods spin up
kubectl get pods -n agents -w

# Check job completion
kubectl get jobs -n agents

# Verify metrics are being scraped
kubectl port-forward -n agents svc/agent-metrics 8080:8080
curl localhost:8080/metrics | grep agent_tasks
You should see: 2 pods start (10 messages ÷ 5 per pod), complete their tasks, and terminate cleanly. Metrics endpoint returns agent_tasks_completed_total counters.
What You Learned
- Use
ScaledJobwith KEDA over CPU-based HPA — agents don't scale on CPU completionMode: Indexedgives agents stable identity for checkpointingSIGTERMhandlers + shared PVCs let agents survive eviction without losing workNetworkPolicyisolates blast radius when an agent misbehaves- Structured logs and Prometheus metrics are non-negotiable at fleet scale
Limitations to know:
ReadWriteManyPVCs require shared storage (EFS, NFS, CephFS) — not available on all cloud providers- KEDA's polling interval (15s) means queue depth can spike before new pods are ready — add a buffer to
maxReplicaCount - This pattern assumes stateless LLM APIs; if you're running local model servers, add GPU node affinity and separate the model deployment from agent pods entirely
When NOT to use this: For fewer than 20 concurrent agents, a simple Deployment with a work queue is easier to operate. Kubernetes Job orchestration pays off at scale, not at small numbers.
Tested on Kubernetes 1.32, KEDA 2.16, RabbitMQ 3.13, Python 3.12 — Ubuntu node pools on AWS EKS