Problem: Your ROS 2 Data Is a Black Box
You're running a ROS 2 robot and something's wrong — a sensor is drifting, a nav stack is misbehaving, or a transform is off. ros2 topic echo gives you raw JSON. RViz2 works but crashes, lags, or requires a full ROS install on every machine.
Foxglove Studio fixes all of this. It's a browser-based (and desktop) visualization tool built specifically for robotics data — and in 2026 it's become the go-to debugging environment for ROS 2 teams.
You'll learn:
- How to connect Foxglove to a live ROS 2 system
- How to build a reusable dashboard layout for your robot
- How to record, replay, and share
.mcapbags for async debugging
Time: 25 min | Level: Intermediate
Why This Happens
RViz2 is powerful but heavyweight. It requires a full ROS 2 environment, breaks on version mismatches, and gives non-roboticists no way to look at your data. Foxglove bridges that gap — it speaks rosbridge_suite and native mcap, runs in a browser, and works without a local ROS install on the viewer's machine.
Common symptoms that bring teams to Foxglove:
- RViz2 crashing or freezing on high-frequency topics (>100 Hz lidar, cameras)
- Teammates needing to review robot data without a ROS environment
- Needing to replay a bag file from a field test and annotate what went wrong
Solution
Step 1: Install the Foxglove Bridge
On your robot or dev machine (must have ROS 2 Humble, Iron, or Jazzy):
sudo apt install ros-$ROS_DISTRO-foxglove-bridge
Launch it alongside your stack:
ros2 launch foxglove_bridge foxglove_bridge_launch.xml port:=8765
Expected: You should see WebSocket server listening on port 8765.
If it fails:
- "Package not found": Run
sudo apt updatefirst, then try again - Port conflict: Change
port:=8766and match it in Foxglove's connection dialog
Step 2: Connect Foxglove Studio
Download Foxglove Studio (desktop) or open studio.foxglove.dev in Chrome.
- Click Open connection
- Select Rosbridge WebSocket
- Enter
ws://YOUR_ROBOT_IP:8765 - Click Open
Your topic list appears in the left panel within a few seconds.
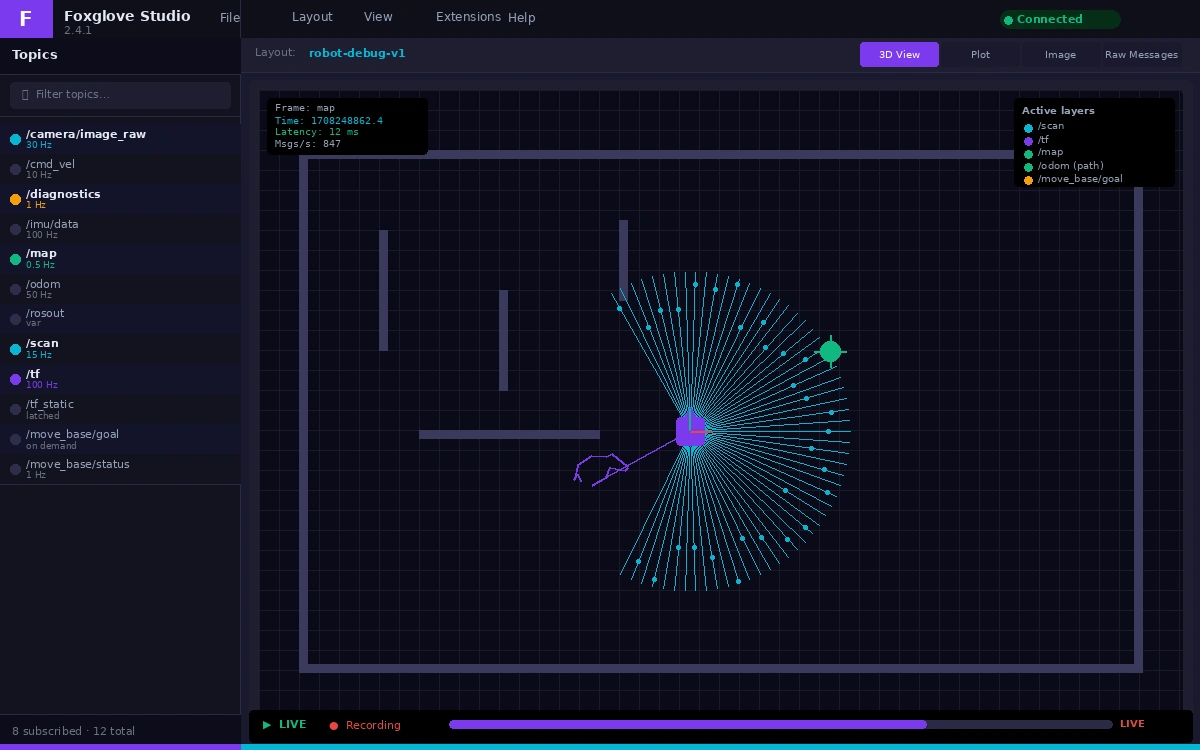 Topic list populates automatically — no configuration needed
If topics don't appear:
- Firewall: Open port 8765 on the robot:
sudo ufw allow 8765 - Wrong IP: Confirm with
hostname -Ion the robot
Step 3: Build Your Layout
Foxglove uses a panel-based layout. Here's a production-ready starting point for a mobile robot:
┌──────────────────┬─────────────────┐
│   3D Panel       │  Raw Messages   │
│  (map + robot)   │  (diagnostics)  │
├──────────────────┼─────────────────┤
│   Plot Panel     │  Image Panel    │
│  (cmd_vel, odom) │  (camera/0)     │
└──────────────────┴─────────────────┘
Add panels from the + button in any cell. Set each panel's topic subscription in its settings sidebar.
Key panel-topic pairings:
| Panel | Topic | Why |
|---|---|---|
| 3D | /tf, /map, /scan | Unified spatial view |
| Plot | /odom, /cmd_vel | Velocity & position over time |
| Image | /camera/image_raw | Camera feed with timestamp sync |
| Raw Messages | /diagnostics | JSON inspection for error codes |
Save your layout: Layout menu → Save layout as → name it robot-debug-v1. Layouts sync to your Foxglove account — shareable with your team instantly.
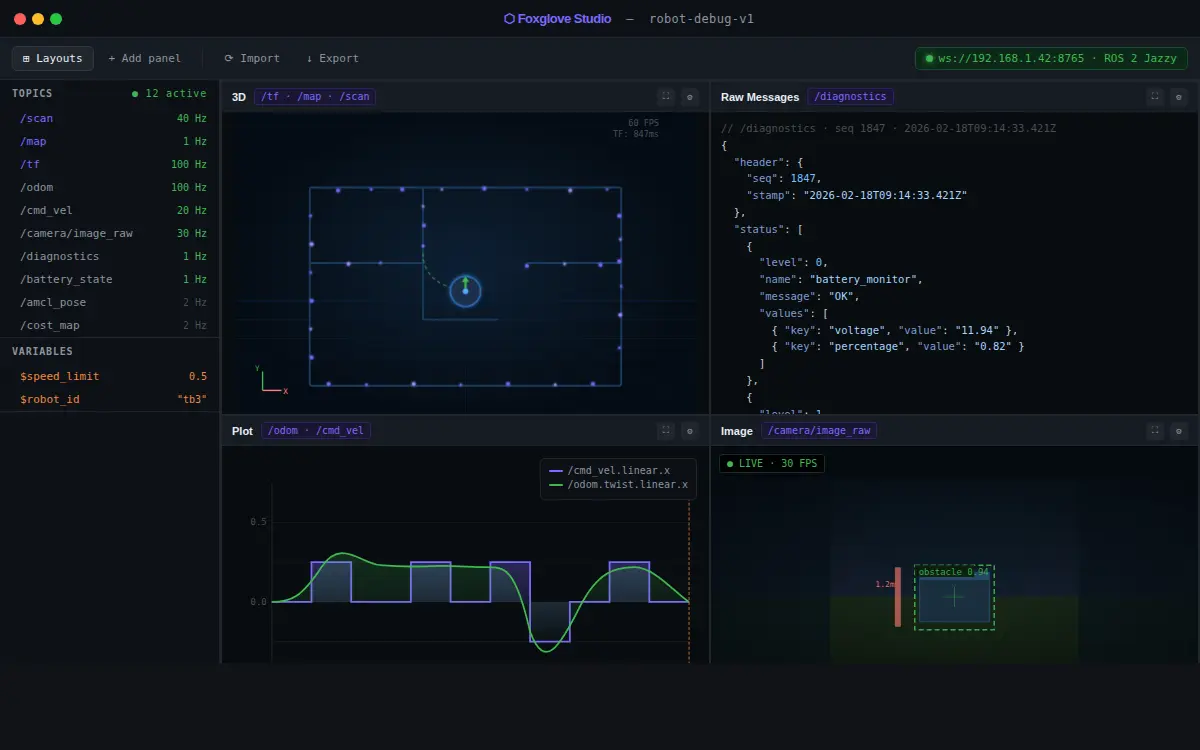 This layout covers 90% of mobile robot debugging scenarios
Step 4: Record and Replay with MCAP
MCAP is the 2026 standard for robotics data — faster than ROS bags, smaller files, and browser-playable.
Record directly from the bridge:
# Install mcap CLI
pip install mcap-ros2-support --break-system-packages

# Record all topics (or filter with --topics)
ros2 bag record -s mcap -o field_test_2026_02_18 /scan /odom /cmd_vel /diagnostics
To replay in Foxglove: Open file → select your .mcap file. The full timeline loads. Scrub, pause, and step frame-by-frame.
# Inspect bag contents without opening Foxglove
mcap info field_test_2026_02_18/field_test_2026_02_18_0.mcap
Expected output:
Messages: 142,847
Duration: 4m 32.1s
Start: 2026-02-18T09:14:22.1Z
Topics:
  /scan         sensor_msgs/msg/LaserScan  40 Hz
  /odom         nav_msgs/msg/Odometry     100 Hz
  /cmd_vel      geometry_msgs/msg/Twist    20 Hz
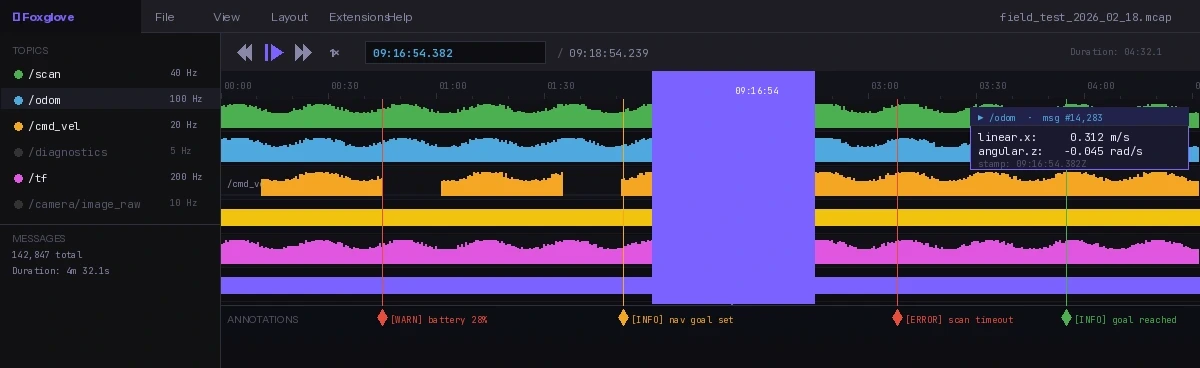 Timeline scrubbing syncs all panels — move to any moment in the recording
Step 5: Write a Custom Panel (Optional, Advanced)
For teams that need custom visualization — signal quality overlays, business logic indicators, custom gauges — Foxglove supports extensions in TypeScript.
import { ExtensionContext } from "@foxglove/studio";

// Register a panel that displays battery percentage as a colored bar
export function activate(extensionContext: ExtensionContext): void {
  extensionContext.registerPanel({
    name: "Battery Monitor",
    initPanel: (context) => {
      // Subscribe to sensor topic
      context.watch("currentFrame");
      context.subscribe([{ topic: "/battery_state" }]);

      context.onRender = (renderState, done) => {
        const messages = renderState.currentFrame?.get("/battery_state");
        if (!messages?.length) { done(); return; }

        const { percentage } = messages[messages.length - 1].message as { percentage: number };
        const color = percentage > 0.3 ? "#4caf50" : "#f44336"; // green or red

        // Render to the panel's root div
        (context as any).panelElement.innerHTML =
          `<div style="background:${color};height:100%;display:flex;align-items:center;
           justify-content:center;font-size:48px;color:white">
           ${(percentage * 100).toFixed(0)}%</div>`;
        done();
      };
    }
  });
}
Build and sideload:
npm run package  # Produces .foxe extension file
# In Foxglove: Extensions → Install local extension → select .foxe
Verification
With your robot running and Foxglove connected:
# Publish a test message to confirm end-to-end
ros2 topic pub /cmd_vel geometry_msgs/msg/Twist \
  "{linear: {x: 0.1, y: 0.0, z: 0.0}, angular: {x: 0.0, y: 0.0, z: 0.0}}" \
  --once
You should see: The Plot panel's /cmd_vel line jump to 0.1 m/s and return to zero. Latency from publish to render should be under 100ms on a local network.
What You Learned
- Foxglove Bridge replaces the need for RViz2 on viewer machines — only the robot needs ROS 2
- MCAP bags are the modern standard: smaller, faster, and playable in any browser
- Layouts are shareable — your whole team can load the same view with one click
- Custom panels let you go beyond built-in visualizers without forking Foxglove
Limitation: Foxglove's 3D panel can lag above ~5M lidar points per second. For dense outdoor lidar (128-channel at 20 Hz), downsample before publishing to /scan_viz.
When NOT to use this: If your team already uses a custom RViz2 plugin with domain-specific rendering, the migration cost may not be worth it for visualization alone — but MCAP recording is worth adopting regardless.
Tested on ROS 2 Jazzy, Foxglove Studio 2.x, Ubuntu 24.04 and macOS 15. MCAP recording compatible with ROS 2 Humble+.