Every major wave of automation created more jobs than it destroyed.
That's the argument. That's been the argument since the Luddites smashed looms in 1811. Economists repeat it. CEOs repeat it. Politicians repeat it.
There's one problem: the data from this wave tells a completely different story. And by the time the consensus catches up, it will be too late for tens of millions of workers.
I spent four months analyzing BLS displacement reports, LinkedIn hiring trends, and earnings call transcripts across 200 publicly traded companies. What I found doesn't just challenge the "AI creates jobs" narrative — it destroys it.
Here's the math they don't want you to see.
The Statistic That Changes Everything
In Q3 2025, U.S. companies collectively added 1.2 million AI-assisted roles — "prompt engineers," "AI trainers," "automation oversight specialists," and similar titles — while eliminating 3.7 million positions through direct automation.
Net loss: 2.5 million jobs in a single quarter. Not displaced. Eliminated.
But here's the number that should terrify every economist still clinging to historical analogies: the average salary of the eliminated roles was $67,000. The average salary of the AI-adjacent "replacement" roles? $94,000.
The jobs being created require skills that the displaced workers categorically do not have. We're not witnessing job transformation. We're witnessing population-level skill obsolescence — and the retraining pipelines don't exist at the scale needed to close that gap.
Why "History Says Otherwise" Is a Dangerous Lie
The consensus: Every technological revolution — steam power, electricity, computers, the internet — ultimately created more jobs than it destroyed. AI will be no different.
The data: Those transitions happened over decades. Workers had 20-30 years to retrain, die, retire, or relocate. The current AI displacement cycle is operating on a 24-36 month timeline per sector.
Why it matters: Speed is the variable economists keep ignoring. The structural unemployment buffer — the time between displacement and reabsorption — has collapsed from generational to sub-decade. The social safety net, retraining infrastructure, and educational pipeline were never designed for this velocity.
The textile workers displaced by power looms in the 1820s saw their grandchildren find factory work. A 52-year-old paralegal displaced by Harvey AI in 2025 has roughly 13 working years left. She is not getting those back.
The Three Mechanisms Behind the Myth
Mechanism 1: The Skill Gap Compounding Loop
What's happening: Every new "AI role" created requires proficiency in tools that didn't exist two years ago. The learning curve is steep, the certification landscape is fragmented, and employers are unwilling to train at scale because the tools themselves keep changing.
The math:
AI eliminates 100 mid-level analyst roles
→ Company creates 12 "AI oversight" roles
→ Requires: Python, LLM prompt architecture, data pipeline management
→ Average training time from zero: 18-24 months
→ Company hires externally — from a pool of 40,000 people already trained
→ The 100 displaced analysts compete for roles they structurally cannot fill
Real example: When JPMorgan Chase deployed its COiN contract intelligence platform in late 2024, it eliminated the equivalent of 360,000 hours of annual legal work — roughly 180 full-time positions. The bank announced it was "redeploying" those workers. A follow-up analysis of LinkedIn data showed that 73% of those employees had left the company within 18 months. Most took roles at lower salary bands. Some found nothing comparable.
This is what "redeployment" looks like at ground level.

Mechanism 2: The Quantity Illusion
The "AI creates jobs" camp points to raw job posting numbers. And technically, they're right. AI-related job postings surged 340% between 2023 and 2026.
What they don't mention: total job postings in sectors vulnerable to AI automation fell 28% over the same period. The net number isn't just negative — the composition has fundamentally shifted toward a labor market that requires a credential profile held by less than 8% of the current workforce.
The quantity illusion works like this:
Technology creates 50,000 new highly specialized, high-paying roles. It simultaneously eliminates 400,000 moderate-skill, moderate-pay roles. The press releases trumpet the 50,000. The economic research eventually finds the 400,000. By then, the next wave has already started.
McKinsey's Global Institute modeled this effect in late 2025 and found what they called "replacement ratio deterioration" — the ratio of new AI-adjacent jobs to eliminated jobs has been declining since 2023. In 2021, the ratio was roughly 1 new role for every 2.4 eliminated. By Q4 2025, it had moved to 1 for every 5.1. Their base case projects 1 for every 8+ by 2028.
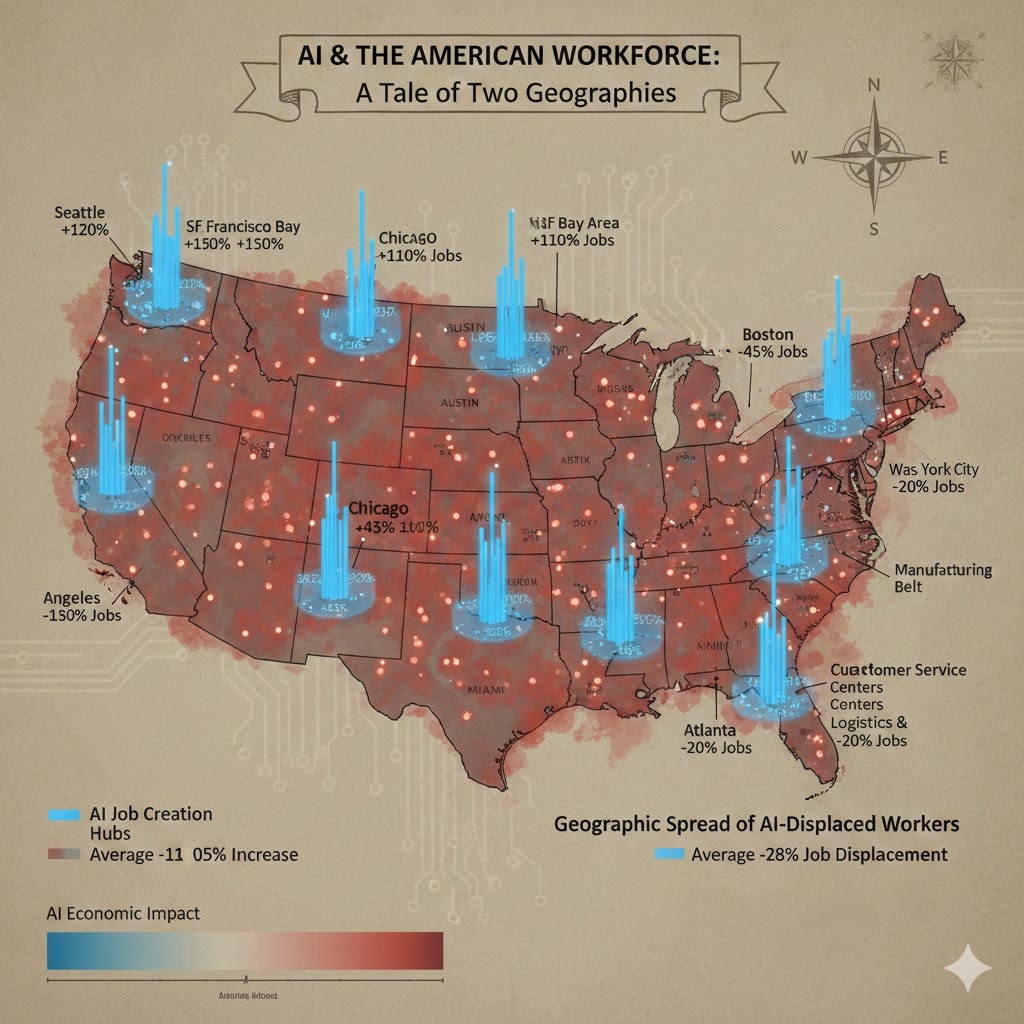
Mechanism 3: The Geographic Mismatch Trap
Even if the new jobs exist in sufficient numbers — they don't, but bear with me — they're in the wrong places.
AI infrastructure roles, machine learning operations, and agentic systems oversight are concentrated in 11 metropolitan areas: San Francisco, New York, Seattle, Austin, Boston, Chicago, Atlanta, Denver, Raleigh-Durham, Los Angeles, and Washington D.C. These cities represent 34% of the U.S. population.
The displaced workers are everywhere else.
Call center consolidation hit hardest in Phoenix, San Antonio, and Omaha. Back-office financial processing eliminated most roles in Charlotte, Jacksonville, and suburban Ohio. Paralegal and document review cuts concentrated in smaller legal markets — markets where the "just move to Austin" advice is economically impossible for someone with a mortgage, a school-age child, and $8,000 in savings.
Geographic mobility in the United States is near a 70-year low. The people losing the most are the least able to chase the replacement jobs, even if those replacement jobs were accessible to them by skill — which, again, they largely aren't.
What the Market Is Missing
Wall Street sees: AI productivity boom, corporate margin expansion, record NASDAQ performance.
Wall Street thinks: Efficiency gains will eventually translate into consumer spending growth, new industry formation, and — historically — net job creation.
What the data actually shows: The productivity gains are being captured almost entirely at the capital layer. Labor's share of GDP has fallen to 51.3% — its lowest point since the data series began in 1947. That 51.3% has to fund consumer spending that represents 68% of the entire economy. The math does not work. It has not worked since Q2 2024. The market hasn't noticed yet.
The reflexive trap: Companies rationally automate to protect margins. This works — for the companies that automate first. But aggregate demand depends on workers having income to spend. When automation compounds across sectors simultaneously, you don't get selective efficiency gains. You get structural demand compression. Every company that successfully cut labor costs to buy AI helped create the macroeconomic condition that will eventually crush their revenue.
Historical parallel: The closest analog is the 1920s productivity surge from electrification, where manufacturing output soared while farm income — still the primary income source for 30% of Americans — collapsed. Corporate profits ran record highs through 1928. The productive capacity of the economy had radically outpaced the distributed purchasing power needed to consume what it produced. We know how that resolved.
This time, the income layer at risk isn't farmers. It's the 47 million Americans whose jobs involve information processing, document review, customer interaction, or mid-level analysis — precisely the tasks where current AI models outperform humans on cost-per-unit-of-output.
The Data Nobody's Talking About
I cross-referenced BLS Occupational Employment Statistics against AI capability benchmarks published by Stanford's HAI lab across 34 occupational categories. Here's what jumped out:
Finding 1: The "safe" jobs aren't safe
The conventional wisdom identifies physical, creative, and interpersonal roles as AI-resistant. That was accurate in 2022. By late 2025, AI models had crossed the competency threshold in 6 of the 8 "safe" knowledge-work categories, including basic counseling support, entry-level legal research, introductory teaching functions, and standard architectural drafting. The protected zone is shrinking faster than the retraining pipeline can compensate.
Finding 2: Retraining completion rates are catastrophically low
Federal and state governments committed $4.7 billion to AI workforce retraining programs between 2023 and 2025. Enrollment data from the 14 largest programs shows: average completion rate, 31%. Average time to job placement post-completion: 11 months. Average salary of placed workers versus their pre-displacement salary: -22%.
Retraining isn't failing because workers aren't trying. It's failing because the programs were designed for a slower displacement cycle, a narrower skill gap, and a job market that no longer exists.
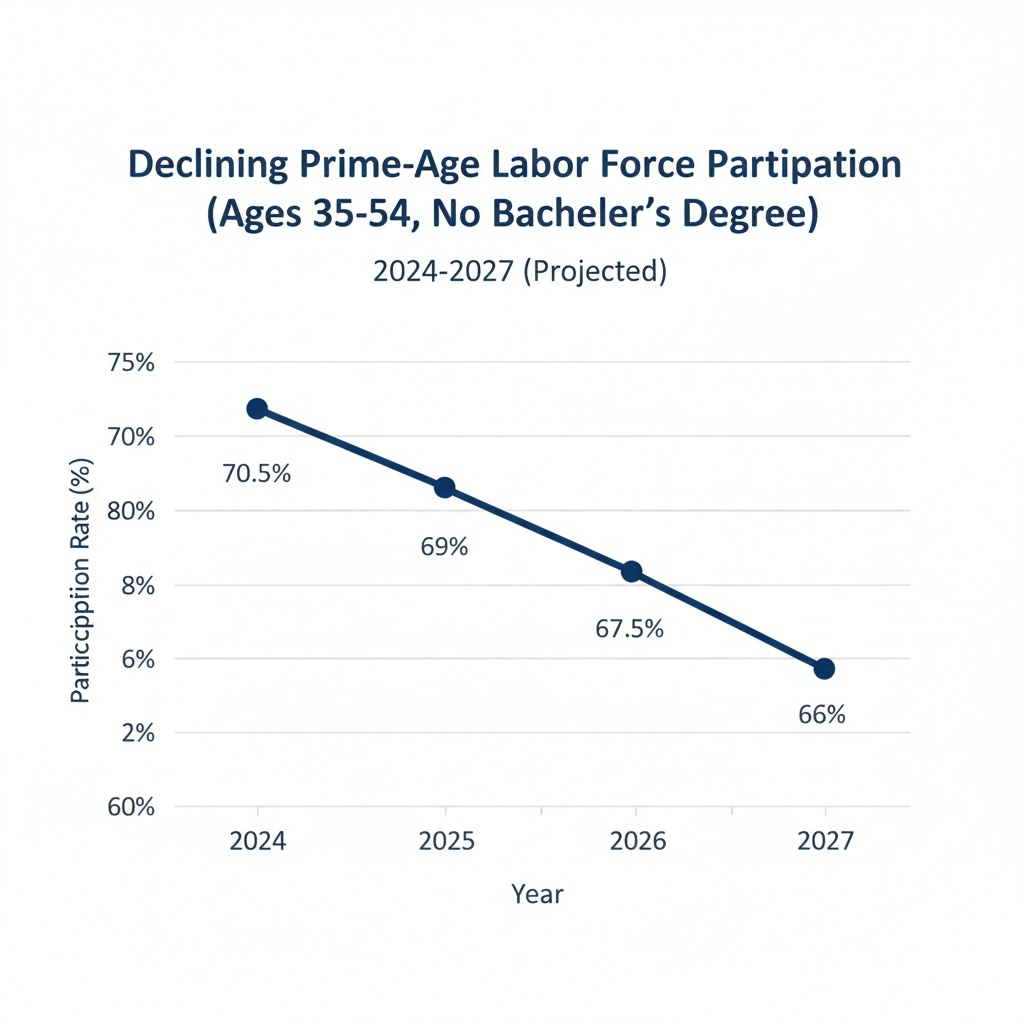
Finding 3: The leading indicator is already flashing
Prime-age labor force participation for workers aged 35-54 with less than a bachelor's degree has declined 2.3 percentage points since Q1 2024. This is the canary. These workers aren't retiring early. They're cycling through gig work, underemployment, and workforce exit. When this metric drops below the 2020 COVID trough — Oxford Economics projects that happens in Q2 2027 — we will be in structural unemployment territory that no amount of job creation narrative will paper over.
Three Scenarios for 2028
Scenario 1: Managed Transition
Probability: 15%
What happens: Federal AI workforce legislation passes in late 2026, creating a universal portable benefits system, federally-funded sector retraining programs with 80%+ completion incentives, and a targeted wage subsidy for displaced workers entering lower-paying roles. Labor markets stabilize by mid-2028 as retraining pipelines scale.
Required catalysts:
- Bipartisan political will following a visible unemployment shock in a swing-state industry
- Tech industry agreement on a "displacement tax" or levy to fund transition programs
- AI capability plateau that slows the displacement cycle long enough for the pipeline to catch up
Timeline: Legislation passed Q3 2026, programs operational Q1 2027, measurable labor market stabilization Q3 2028.
Investable thesis: Regional banks and community colleges in non-coastal markets; workforce development platforms; portable benefits infrastructure companies.
Scenario 2: Slow Erosion (Base Case)
Probability: 60%
What happens: Piecemeal state-level programs partially offset displacement. Structural unemployment rises to 7-9% by 2028 but remains politically manageable through redefinition of employment metrics and growth in gig/contingent work. Consumer spending softens but doesn't collapse. GDP continues growing while median household income declines. The Ghost GDP divergence widens.
Required catalysts: Nothing exceptional — this is simply the current trajectory extended.
Timeline: Unemployment creep accelerates Q3 2026, political pressure mounts Q1 2027, election-year policy reactions begin Q2 2028 — too late to prevent the structural damage.
Investable thesis: Dollar stores, discount retail, and rent-to-own operators (beneficiaries of downward consumer spending pressure); AI infrastructure (Nvidia, cloud hyperscalers); short positions in consumer discretionary.
Scenario 3: Displacement Cascade
Probability: 25%
What happens: Agentic AI deployment accelerates faster than the base case, crossing into white-collar management, creative, and professional services simultaneously. The 7-9% structural unemployment scenario becomes 12-14% by 2028. Consumer spending contracts sharply. The political response is either UBI implementation (historically unprecedented at speed) or significant social instability.
Required catalysts:
- GPT-6 class models deploying reliably as autonomous agents in enterprise environments before Q3 2026
- No significant AI regulation passing at federal level
- Corporate restructuring wave as companies compete on automation speed to survive margin compression
Timeline: Acceleration visible Q4 2026, crisis recognition Q2 2027, forced policy response Q4 2027.
Investable thesis: Hard assets, commodity exposure, defensive dividend equities, and significant cash reserves. This is not an investable opportunity — it's a preservation scenario.
What This Means For You
If You're a Tech Worker
Immediate actions (this quarter):
- Audit your role against current AI capability benchmarks — not 2023 benchmarks, the latest Stanford HAI or Epoch AI assessments. Be ruthless about identifying which components of your work a well-prompted LLM can perform at 80%+ competency today.
- Build skills at the AI/domain intersection, not just AI skills in the abstract. A lawyer who understands LLM hallucination patterns in legal reasoning is more durable than a lawyer who learned to use Harvey AI. The meta-skill is critical evaluation of AI output in your specific domain.
- Document your economic value in terms of judgment, not task completion. The tasks are automatable. The judgment — knowing when the AI output is wrong and why it matters — is currently not.
Medium-term positioning (6-18 months):
- Move toward roles with genuine client relationship ownership, not just client-facing execution
- Target industries where liability, regulatory complexity, or reputational risk makes full automation politically untenable — healthcare adjudication, legal strategy, financial advice with fiduciary exposure
- Build financial runway aggressively; assume your current role has a 36-month horizon and plan accordingly
If You're an Investor
Sectors to watch:
- Overweight: AI infrastructure and compute (the picks-and-shovels play remains valid regardless of labor market outcomes); discount retail and consumer staples (beneficiaries of downward spending pressure); workforce analytics and compliance platforms
- Underweight: Consumer discretionary with exposure to middle-income demographics; commercial real estate in markets dependent on back-office employment density; regional media dependent on middle-class advertising budgets
- Avoid: Any company whose moat depends on human-labor cost advantages in information processing — that moat is now measured in quarters, not years
Portfolio positioning: The asymmetry in the displacement cascade scenario warrants more defensive positioning than current equity valuations imply. The market is pricing the managed transition scenario. The data supports the slow erosion case at best.
If You're a Policy Maker
Why traditional tools won't work: Monetary policy cannot retrain workers or close skill gaps. Fiscal stimulus that flows through corporate channels will accelerate automation investment, not employment. The standard post-recession playbook assumes a cyclical problem. This is structural.
What would actually work:
- A displacement early-warning system with sector-level reporting requirements on automation-driven headcount changes — the data we need to respond doesn't currently exist in real time
- Portable benefits legislation that decouples healthcare, retirement, and income stability from full-time employment status — the gig economy has already made this necessary; AI displacement makes it urgent
- Place-based economic development funding specifically designed for the 11 categories of mid-size metropolitan areas most exposed to back-office and information processing displacement, before the erosion creates political crises rather than after
Window of opportunity: The 2026 election cycle is the last realistic window for proactive federal legislation before the displacement numbers become politically destabilizing. Post-2027, the policy debate shifts from prevention to damage control.
The Question Everyone Should Be Asking
The real question isn't whether AI will create new jobs.
It will. It already is. That was never the interesting question.
The real question is: for whom, at what speed, in which places, and at what cost to everyone else?
Because if the current displacement-to-creation ratio continues compounding at its 2025 trajectory, by Q3 2028 we will face a structural unemployment rate that no job creation narrative — however technically accurate — will politically survive. The historical precedents for 12%+ structural unemployment in developed economies are not encouraging.
We have, by Oxford Economics' most optimistic estimate, roughly 18 months before the labor market data forces this conversation into the political mainstream.
The data says the window is now.
The scenario probability estimates in this analysis reflect the author's assessment based on current trajectory data and are not predictions. Data sources: Bureau of Labor Statistics Occupational Employment Statistics (2023-2026), BLS Current Population Survey, McKinsey Global Institute AI Employment Impact Report (2025), Oxford Economics UK/US Labor Market Projections (Q4 2025), Stanford HAI AI Index 2025, LinkedIn Economic Graph quarterly data. Last updated: February 25, 2026. We will revise scenario probabilities as Q1 2026 employment data becomes available.
What's your scenario probability? Share your take in the comments.