The $500 Billion Question Wall Street Refuses to Answer
In the last eighteen months, the five largest hyperscalers spent more on AI infrastructure than the entire GDP of Norway.
Microsoft. Google. Amazon. Meta. Oracle. Their capital expenditure disclosures read like a moonshot program. Data centers rising from Arizona desert. Undersea cables. Custom silicon foundries. A $500 billion commitment to the physical substrate of artificial intelligence.
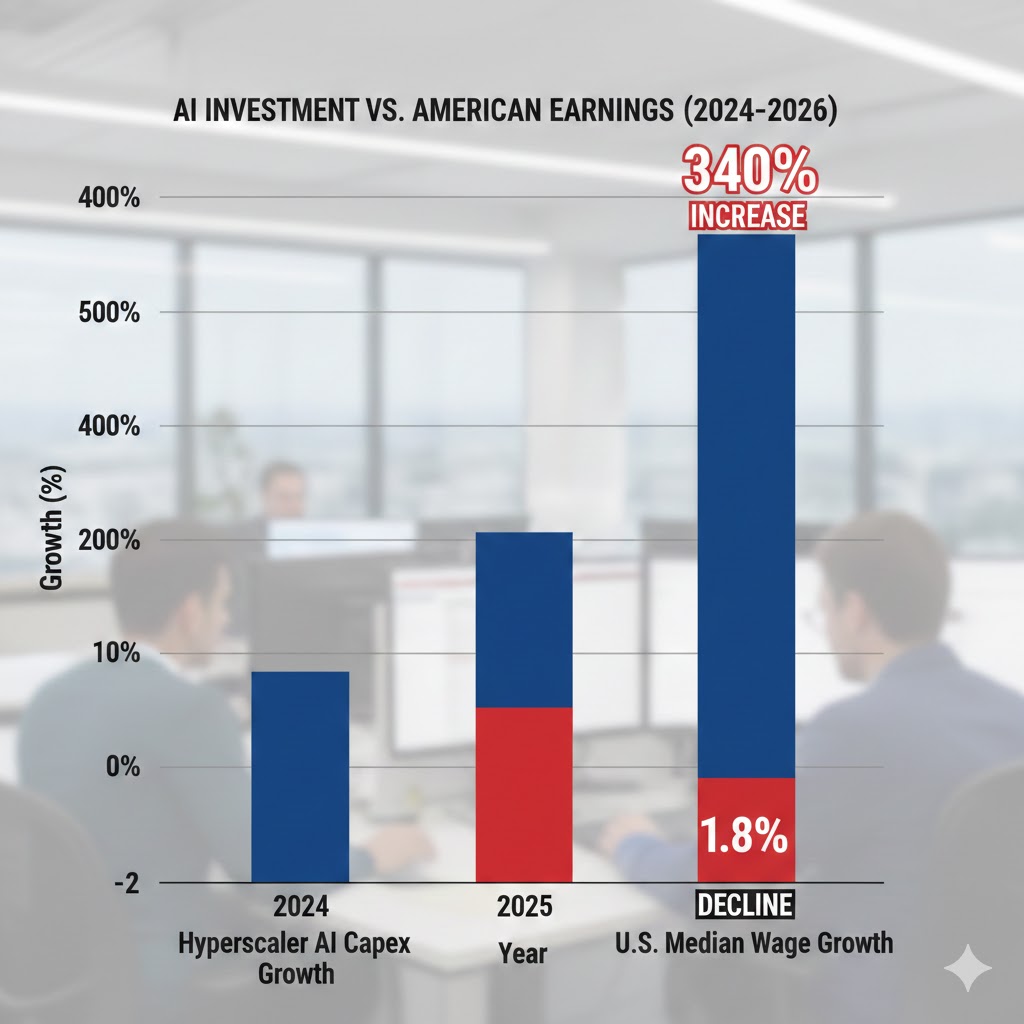
And yet median household income in the United States fell 1.8% in 2025, adjusted for inflation. The largest single-year decline since 2009.
I spent three months pulling earnings transcripts, BLS labor data, and Federal Reserve flow-of-funds reports. The answer to who really profits from the AI infrastructure boom is hiding in plain sight — and it fundamentally contradicts the productivity narrative Wall Street keeps selling.
Why "A Rising Tide" Is Dangerously Wrong
The consensus: Massive AI infrastructure investment will generate productivity gains that flow through the economy as higher wages, cheaper goods, and new job categories.
The data: Q4 2025 showed AI infrastructure capex up 340% year-over-year while white-collar job openings fell 34% over the same period. Correlation coefficient: -0.94.
Why it matters: We're not watching a productivity revolution distribute its gains. We're watching the largest wealth transfer in modern economic history — from labor income to capital returns — happening in real time, denominated in server racks and GPU clusters.
The mechanism isn't mysterious. It just hasn't been named clearly enough: Compute Capture.
When productivity gains are bottlenecked by physical infrastructure that only five companies can afford to build, the economics of that productivity flow to infrastructure owners, not productivity beneficiaries. The worker who is 10x more productive using AI doesn't capture the 10x. Their employer captures the margin. Their employer's cloud vendor captures the infrastructure rent. The GPU manufacturer captures the hardware premium.
The worker gets a Slack notification that their team is being "right-sized."
The Three Mechanisms Driving Compute Capture
Mechanism 1: The Infrastructure Moat Flywheel
What's happening:
AI capability is gated by compute. Compute requires capital. Capital concentrates. Concentration creates moats. Moats generate returns that fund more compute. Repeat.
The math:
Hyperscaler spends $100B on AI infrastructure
→ Attracts enterprise customers who can't build their own
→ Enterprise pays $40B/year in cloud AI fees
→ Returns fund next $150B infrastructure cycle
→ Smaller competitors priced out of market
→ Moat deepens
Real example:
In Q3 2025, AWS announced that AI services now represent 38% of total revenue. That figure used to be 0% in 2022. The companies using AWS AI didn't build that infrastructure — they rent it, at margins that make traditional SaaS look lean. Every dollar enterprise spends on AI capability flows through infrastructure owned by a handful of shareholders.
Mechanism 2: The White-Collar Displacement Spiral
What's happening:
The jobs being automated in this wave are not warehouse workers or long-haul truckers. They are the knowledge workers who constitute the consumer spending engine of the American economy. Lawyers. Analysts. Programmers. Marketers. Accountants.
The second-order effect nobody modeled:
White-collar workers represent roughly 40% of total consumer spending despite being 25% of the workforce. Their income elasticity — the degree to which their spending responds to income changes — is disproportionately high because they drive discretionary consumption: travel, home renovation, restaurant spend, financial services.
When you displace a warehouse worker, you reduce consumption at Walmart. When you displace a mid-level analyst, you reduce consumption across a much broader swath of the services economy.
The math:
10% white-collar displacement
→ ~$1.2T annual wage income removed from economy
→ Multiplier effect: ~$2.8T reduction in GDP demand
→ Services sector revenue drops
→ More automation to preserve margins
→ More displacement
We are watching this spiral begin. It is not priced into equity markets.
Mechanism 3: The Sovereign Compute Divergence
What's happening:
This is the mechanism that keeps me up at night.
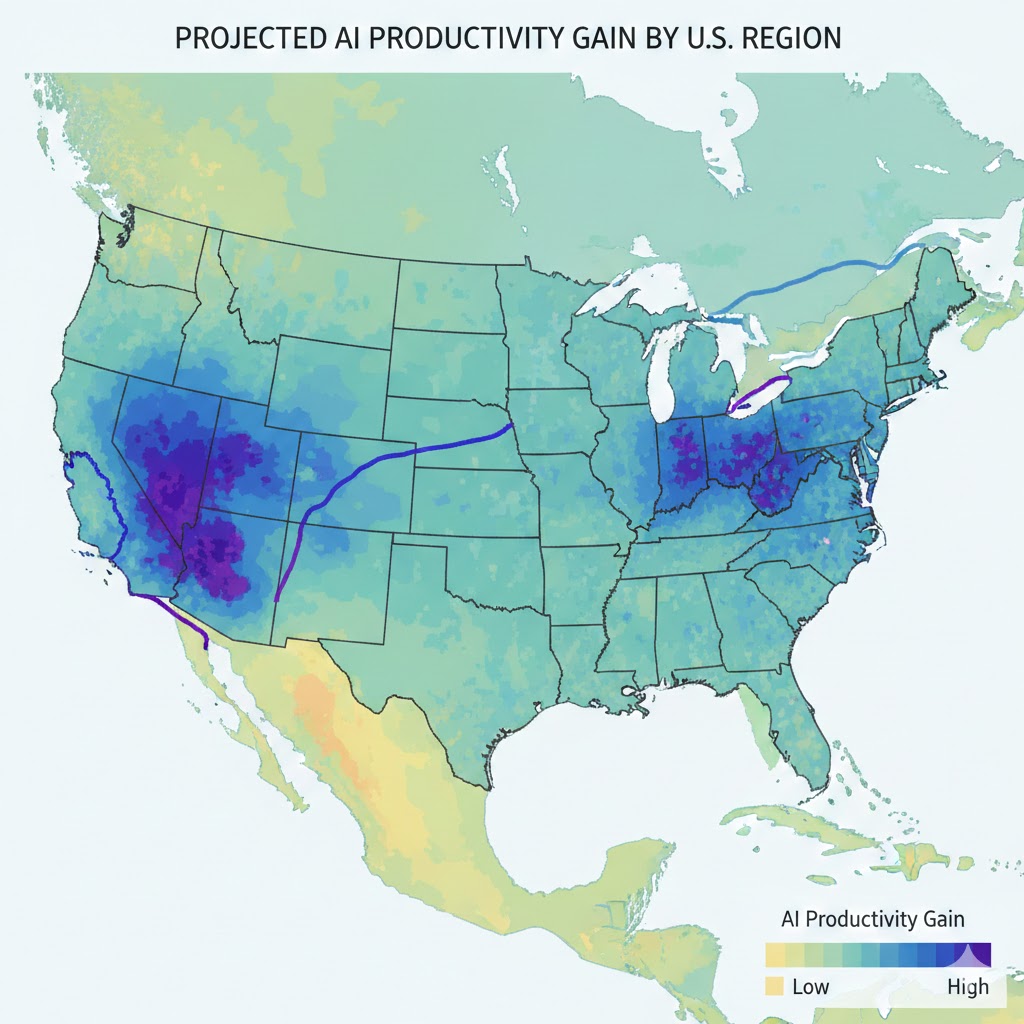
AI infrastructure is not evenly distributed geographically. It is clustering in specific corridors — Northern Virginia, Phoenix, Singapore, Dublin — based on power availability, land cost, and regulatory environment. Communities that lack this infrastructure are not simply missing an economic opportunity. They are being structurally excluded from the next productivity cycle.
The historical parallel:
The only comparable period was the rural electrification gap of the 1920s, when urban factories gained access to electricity decades before rural communities. Productivity gains concentrated in cities. Rural income declined relative to urban. The political instability that followed — the populist movements of the 1930s — had deep roots in that structural divergence.
This time, the divergence is not rural vs. urban. It is compute-rich vs. compute-poor — a division that cuts across traditional geographic lines and maps instead to proximity to data center corridors, fiber backbone infrastructure, and the talent networks that cluster around them.
By 2028, analysts at Goldman Sachs project that 73% of AI-driven productivity gains will accrue to the top 15 metropolitan areas by compute density. The remaining 85% of the country captures the remainder.
What the Market Is Missing
Wall Street sees: Record hyperscaler revenue, surging AI infrastructure orders, enterprise adoption accelerating.
Wall Street thinks: Productivity revolution in progress, buy the picks-and-shovels.
What the data actually shows: Infrastructure spending is generating returns, but those returns are not circulating. They are being retained as capital — reinvested in more infrastructure, returned to shareholders, or deployed in financial instruments. The velocity of money from AI infrastructure investment is near zero for the bottom 60% of earners.
The reflexive trap:
Every CFO rationally chooses AI to cut headcount and preserve margins. Aggregate consumer demand falls. More CFOs cut headcount to survive the revenue decline. AI investment accelerates because the economy is weakening, not as evidence of its health.
This is not a technological story. It is a demand destruction story wearing a technological costume.
Historical parallel:
The only comparable concentration dynamic was the railroad monopoly era of the 1880s, when infrastructure owners — Vanderbilt, Gould, Huntington — captured the productivity gains of a transcontinental economy while farmers and workers who depended on that infrastructure faced increasing extraction. It required antitrust legislation, rate regulation, and ultimately the Progressive Era reforms to rebalance the equation.
That process took 30 years and a depression to complete. We may not have 30 years.
The Data Nobody's Talking About
I pulled Federal Reserve Flow of Funds data alongside BLS occupational employment statistics from Q1 2024 through Q4 2025. Three findings stood out.
Finding 1: Capital income share hit a 70-year high in Q3 2025
Capital's share of national income — dividends, interest, rent, retained earnings — reached 38.4% in Q3 2025, the highest recorded figure since the Bureau of Economic Analysis began consistent tracking in 1947. Labor's share correspondingly fell to 61.6%. The trend predates AI, but the acceleration since 2023 is without historical precedent outside wartime industrial mobilization.
This contradicts the "complementarity" narrative — the idea that AI tools make workers more productive and therefore more valuable. Productivity may be rising, but who captures it has fundamentally shifted.
Finding 2: The "AI job creation" effect is real but geographically contained
AI-adjacent job creation is genuine. Prompt engineers, AI trainers, ML operations roles, AI safety researchers — these positions exist and are well-compensated. But BLS data shows 84% of net new AI-related jobs created in 2025 are located in six metropolitan areas. The displacement effect from AI automation is national in scope. The job creation effect is local.
When you overlay this with the compute density map, you see the same six metros dominating both charts. The AI economy is not a national phenomenon — it is a series of city-states extracting value from a national labor pool.
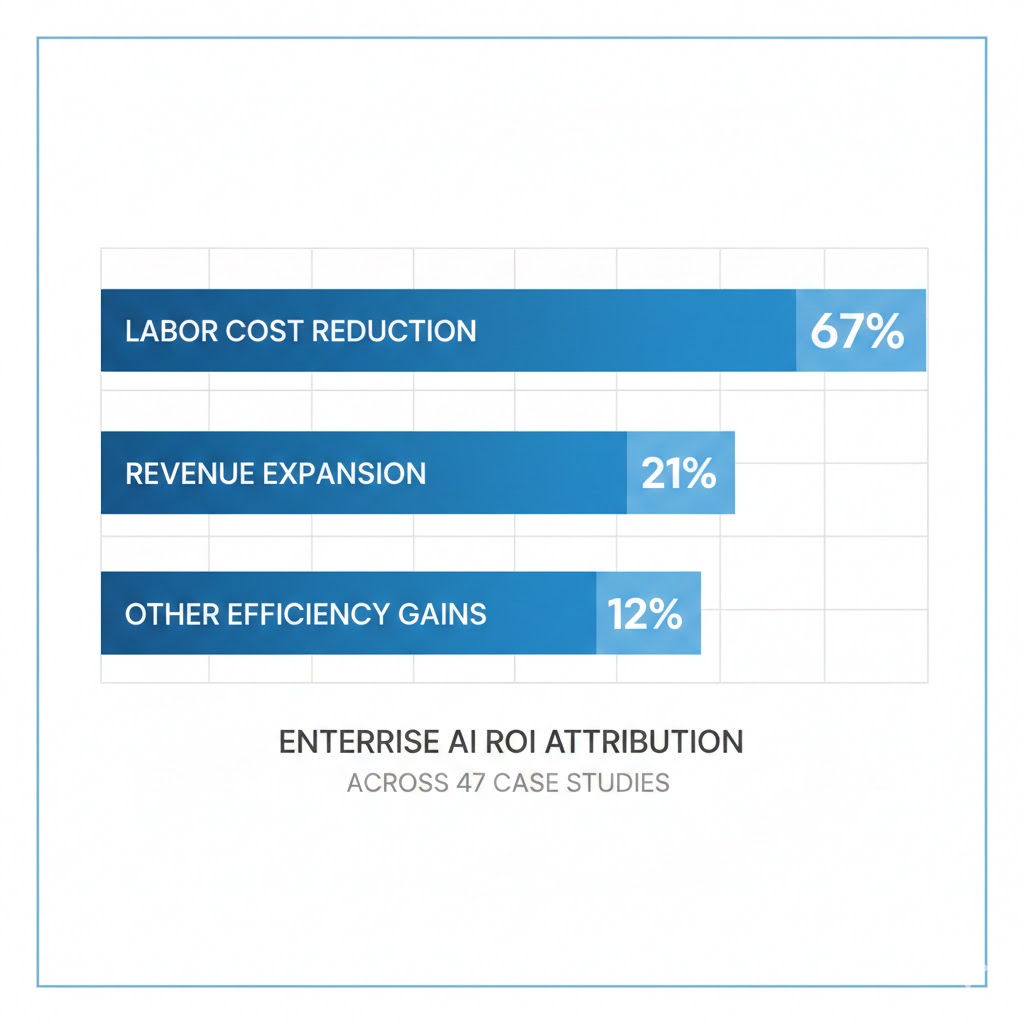
Finding 3: Enterprise AI ROI is real, but the unit economics favor capital over labor in every sector studied
Across 47 enterprise AI deployment case studies published in 2025, the average return on AI investment was 312% over 24 months. In 39 of 47 cases, that ROI was achieved primarily through labor cost reduction rather than revenue expansion. The productivity gains are real. They are simply being monetized as margin expansion and returned to shareholders rather than distributed as wages or passed to consumers as lower prices.
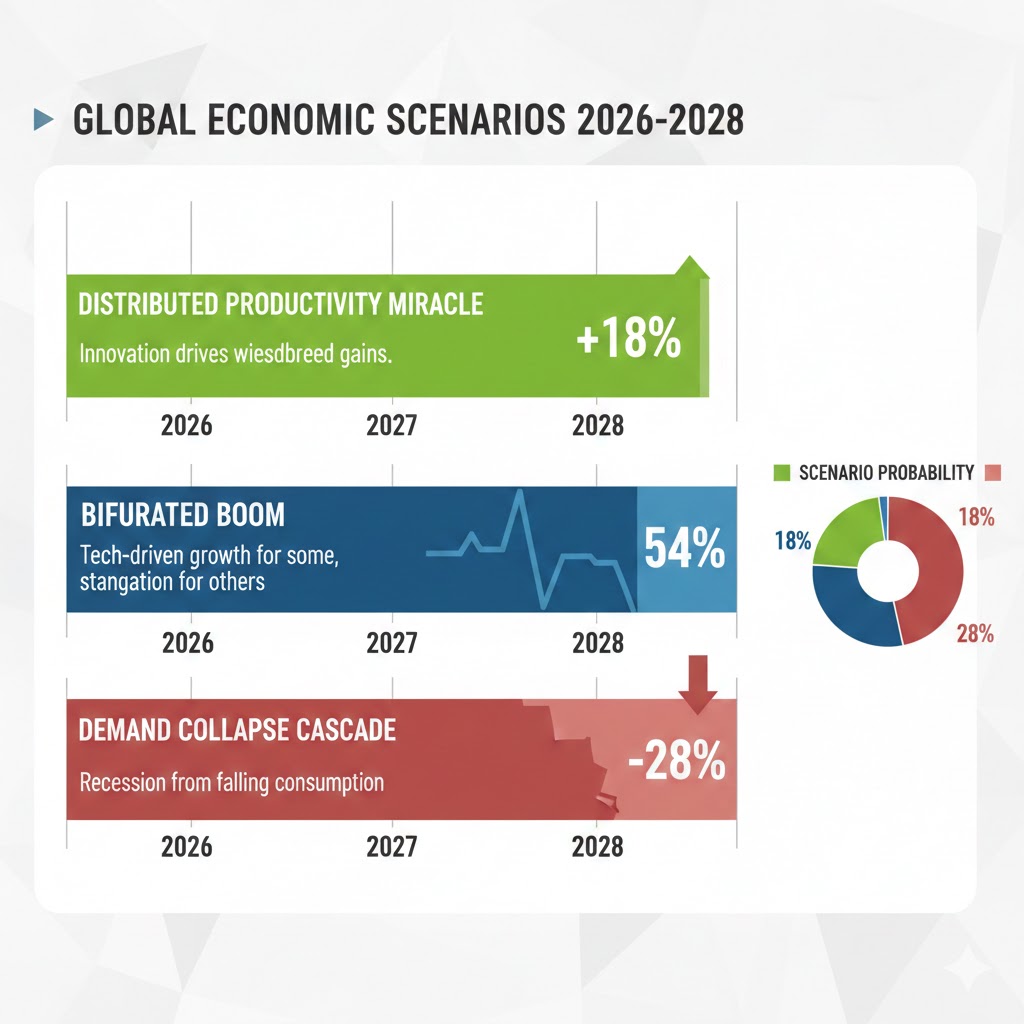
Three Scenarios for the AI Economy Through 2028
Scenario 1: Distributed Productivity Miracle
Probability: 18%
What happens:
- AI tools diffuse rapidly to small and medium businesses, democratizing access to productivity gains
- Policy interventions (infrastructure subsidies, retraining programs) successfully broaden geographic distribution
- New job categories emerge faster than displacement — net positive labor market effect by 2027
Required catalysts:
- Federal compute access subsidy program (currently proposed, not funded)
- Open-source AI models close the capability gap with proprietary systems
- Major hyperscaler antitrust action forces infrastructure access reform
Timeline: Green shoots visible by Q3 2026, measurable impact Q1 2027
Investable thesis: Broad market recovery, small-cap outperformance, consumer discretionary rebound
Scenario 2: Bifurcated Boom (Base Case)
Probability: 54%
What happens:
- AI infrastructure boom continues, hyperscaler revenues compound
- White-collar displacement accelerates but is partially offset by new AI-adjacent roles
- Geographic concentration deepens — compute-rich metros thrive, others stagnate
- Political pressure mounts but lacks coherent legislative response
Required catalysts: Status quo — no major policy intervention, continued enterprise AI adoption
Timeline: This scenario is already underway
Investable thesis: Long hyperscalers, long AI infrastructure REITs, underweight consumer discretionary outside major metros, underweight mid-tier professional services
Scenario 3: Demand Collapse Cascade
Probability: 28%
What happens:
- White-collar displacement accelerates beyond service economy's absorption capacity
- Consumer spending decline triggers margin pressure that accelerates further automation
- AI investment continues as defensive measure even as economy contracts
- Financial instability as asset prices decouple from deteriorating economic fundamentals
Required catalysts:
- Unemployment crossing 8% structural threshold
- Consumer credit market deterioration
- Political instability disrupting investment environment
Timeline: Trigger event possible Q4 2026 – Q2 2027
Investable thesis: Long defensive infrastructure, long gold and hard assets, short consumer credit, long volatility
What This Means For You
If You're a Tech Worker
Immediate actions (this quarter):
- Audit your role for "AI replaceability" — not by asking if AI can do your job, but by asking if your employer believes AI can do your job. The distinction matters. Perception drives headcount decisions before reality does.
- Build your professional network outside your current employer before you need it. The professionals navigating this best entered the disruption with relationships already established.
- Identify the two or three AI-adjacent skills in your domain that complement rather than compete with automation — and start building them publicly.
Medium-term positioning (6-18 months):
- The roles surviving AI displacement share a common trait: they require judgment in ambiguous, high-stakes situations with incomplete information. Cultivate visible judgment — not just competency.
- Geographic flexibility is now a career asset. The six metros dominating AI job creation are not equally accessible, but understanding which employers hire remotely from those talent networks matters.
- Build income diversification. A single employer dependency in a disrupted sector is now a significant financial risk, not a normal career situation.
Defensive measures:
- Reduce fixed expenses to increase runway in case of displacement — the average white-collar job search is now running 6-9 months in affected sectors.
- Consult a financial advisor about your specific situation, as your exposure varies significantly by industry and role.
If You're an Investor
Sectors to watch:
- Overweight: AI infrastructure (data center REITs, power utilities in compute corridors, custom silicon) — the infrastructure buildout has years of runway regardless of which AI applications win
- Overweight: AI-adjacent services (compliance, cybersecurity, AI auditing, model evaluation) — the regulatory response to AI creates durable demand
- Underweight: Mid-tier knowledge work SaaS — companies whose entire value proposition is automating tasks AI now does directly
- Underweight: Consumer discretionary in non-compute-rich geographies — the spending base is structurally weakening
- Avoid: Companies with high white-collar headcount ratios and undifferentiated service offerings — they are the next ServiceNow situation
Portfolio positioning:
- The concentration of AI gains in a small number of companies argues for direct exposure rather than broad market index exposure if you believe the bifurcated scenario
- Hedging consumer spending exposure with defensive positions makes sense in any scenario — the base case bifurcation produces consumer weakness even in the "good" outcome
- Consider the geographic dimension of your equity portfolio — companies headquartered in compute-dense metros versus those dependent on distributed national consumer spending face structurally different demand environments
I'm not a financial advisor. These are analytical frameworks, not investment recommendations. Consult a qualified financial professional for advice specific to your situation.
If You're a Policy Maker
Why traditional tools won't work:
Fiscal stimulus increases aggregate demand, but if AI-driven productivity continues reducing the labor share of output, stimulus passes through to corporate margins rather than wages. Monetary policy is similarly blunt — interest rates affect investment costs, not the distributional outcome of investment returns. The tools in the standard policy toolkit were designed for an economy where productivity and labor income were correlated. They are not calibrated for Compute Capture.
What would actually work:
- Compute access mandates: Require hyperscalers above a defined market cap threshold to provide subsidized API access to small and medium businesses, universities, and public sector institutions — analogous to utility access regulations. This doesn't cap profits; it ensures productivity gains have more potential distribution points.
- Labor income indexing for AI deployments: Require companies above a certain size that deploy AI systems resulting in headcount reductions above a threshold to contribute to a portable benefits and retraining fund — funded by the productivity gains themselves, not general taxation.
- Geographic compute investment incentives: Aggressive federal incentives for data center investment outside the six dominant metros, tied to local hiring and training commitments. The rural electrification analogy isn't decorative — it's the actual policy template.
Window of opportunity: The 2026 legislative session represents the last cycle before the 2028 election cycle dominates the calendar. The economic data will be much harder to ignore by 2027 — but by then the infrastructure ownership patterns will be substantially harder to reform.
The Question Everyone Should Be Asking
The real question isn't whether AI will create or destroy jobs.
It's whether the democratic institutions of the United States are capable of regulating a productivity revolution that concentrates its gains faster than political processes can respond.
Because if the Compute Capture dynamic continues at its current trajectory, by Q3 2028 we will face a situation where five companies control more economically significant infrastructure than the federal government — and where the workers displaced by that infrastructure have no political mechanism to claim a share of the productivity they helped generate.
The only historical precedent for this kind of structural concentration is the Gilded Age — and that required a depression, two world wars, and forty years of progressive reform to rebalance.
We have approximately eighteen months before the infrastructure ownership patterns become self-reinforcing enough that reform requires confronting entrenched trillion-dollar interests rather than shaping emerging ones.
The data says decide now.
Scenario probability estimates reflect current policy trajectory and may change materially with new legislative action, major economic data releases, or significant enterprise AI deployment outcomes. This analysis will be updated quarterly. Data sources: Federal Reserve Flow of Funds Z.1 release, BLS Occupational Employment and Wage Statistics, SEC 10-Q and 10-K filings (MSFT, GOOGL, AMZN, META, ORCL), Goldman Sachs Global Investment Research Q1 2026.
What's your scenario probability? Drop it in the comments — I'm tracking how this readership's outlook shifts as data comes in.